
Capabilities
Tools used inside real reporting work.
SQL, Power BI, Power Platform, Python, Excel and Power Query have different jobs. These pages show where each tool enters a working routine, which records it handles and what evidence proves the build.
SQL
SQL gives invoice lines, orders, receipts and reference data a declared grain before they become shared reporting totals.
See how SQL is used
SQL-backed Reporting Foundation
A wholesale reporting mart built from Microsoft’s Wide World Importers sample database so sales, purchasing, stock and margin reports use the same customers, products, dates and totals.
Inspect the projectPower BI
Power BI connects an agreed management question to a dimensional model, explicit measures and the records needed to explain the result.
See how Power BI is used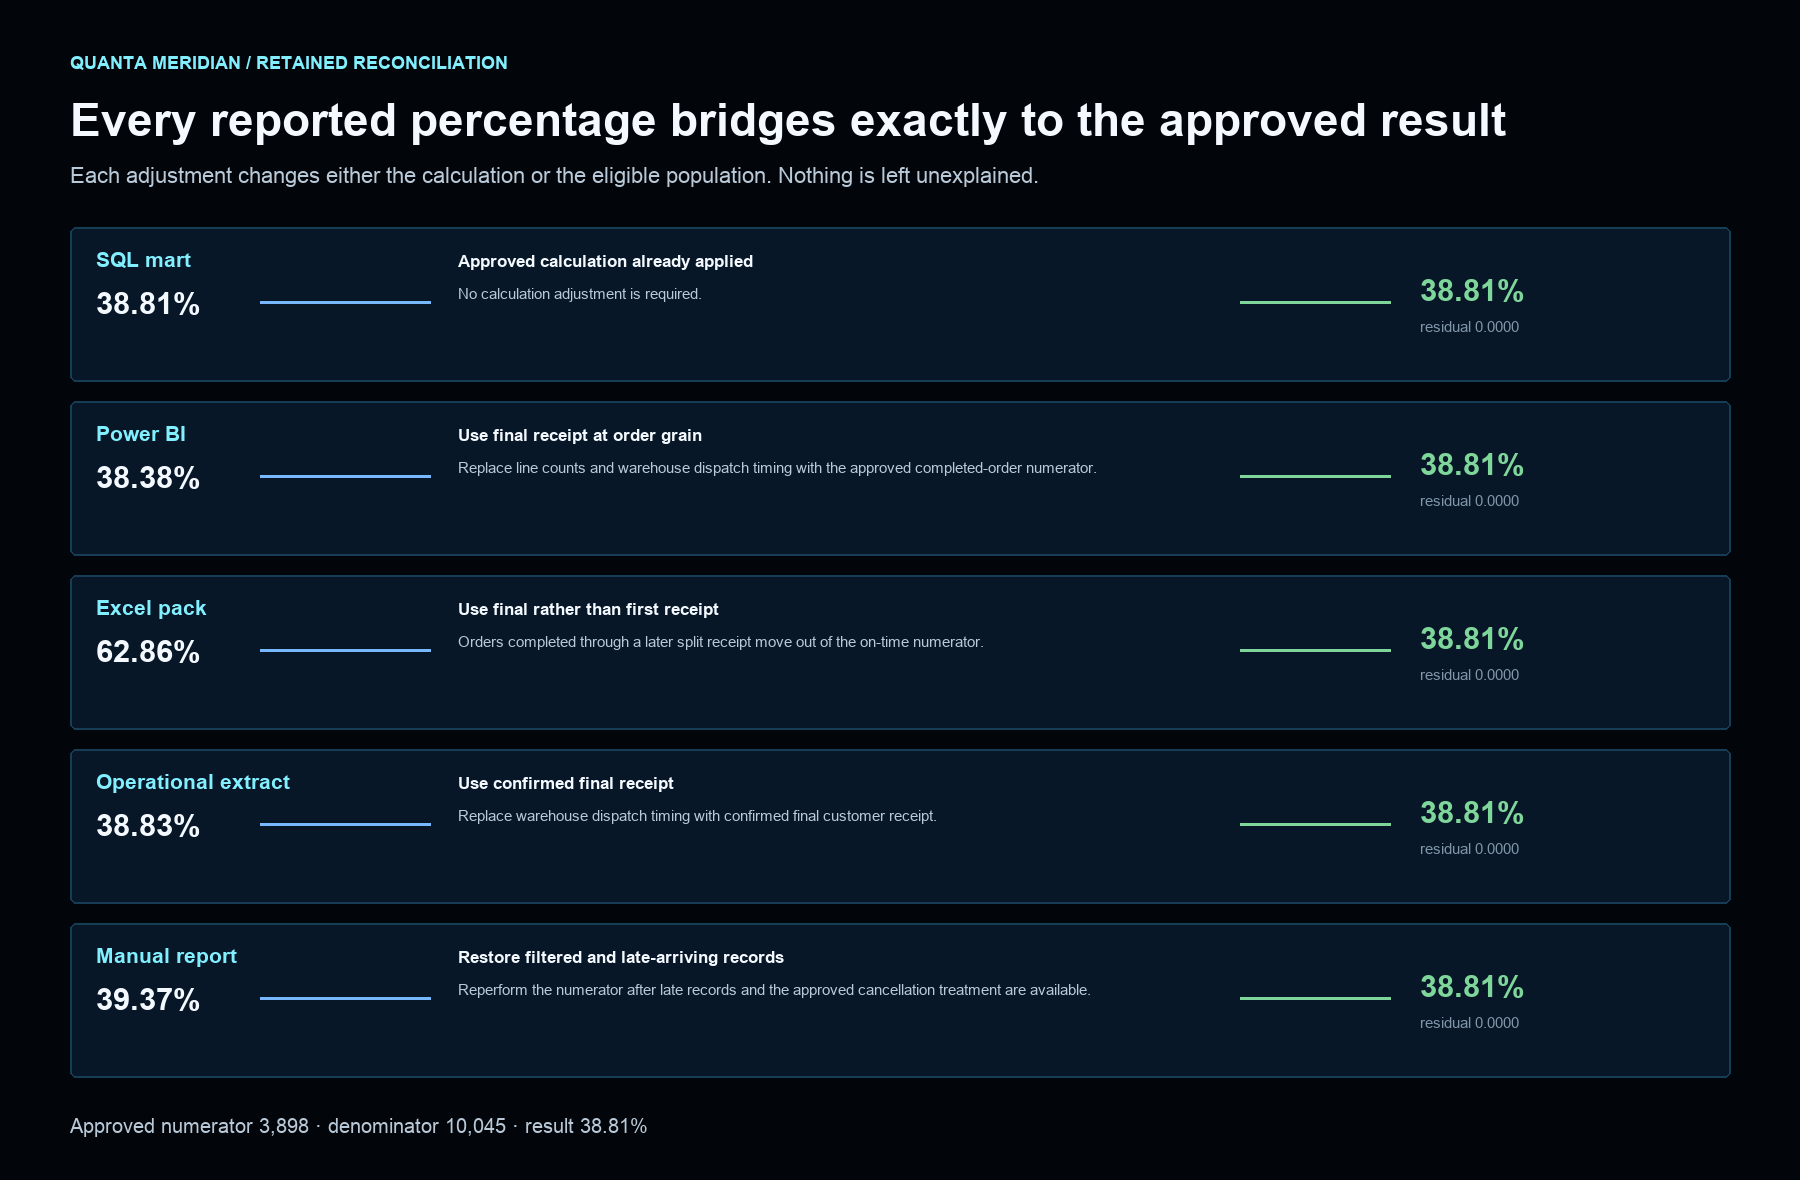
On-time Delivery Metric Reconciliation
A row-level reconciliation explaining why the SQL reporting mart, Power BI model, Excel management pack, operational extract and manually maintained report show different on-time delivery percentages.
Inspect the projectPython
Python turns a reporting check into an executable rule that retains the failed rows, run time, affected report and later retest.
See how Python is used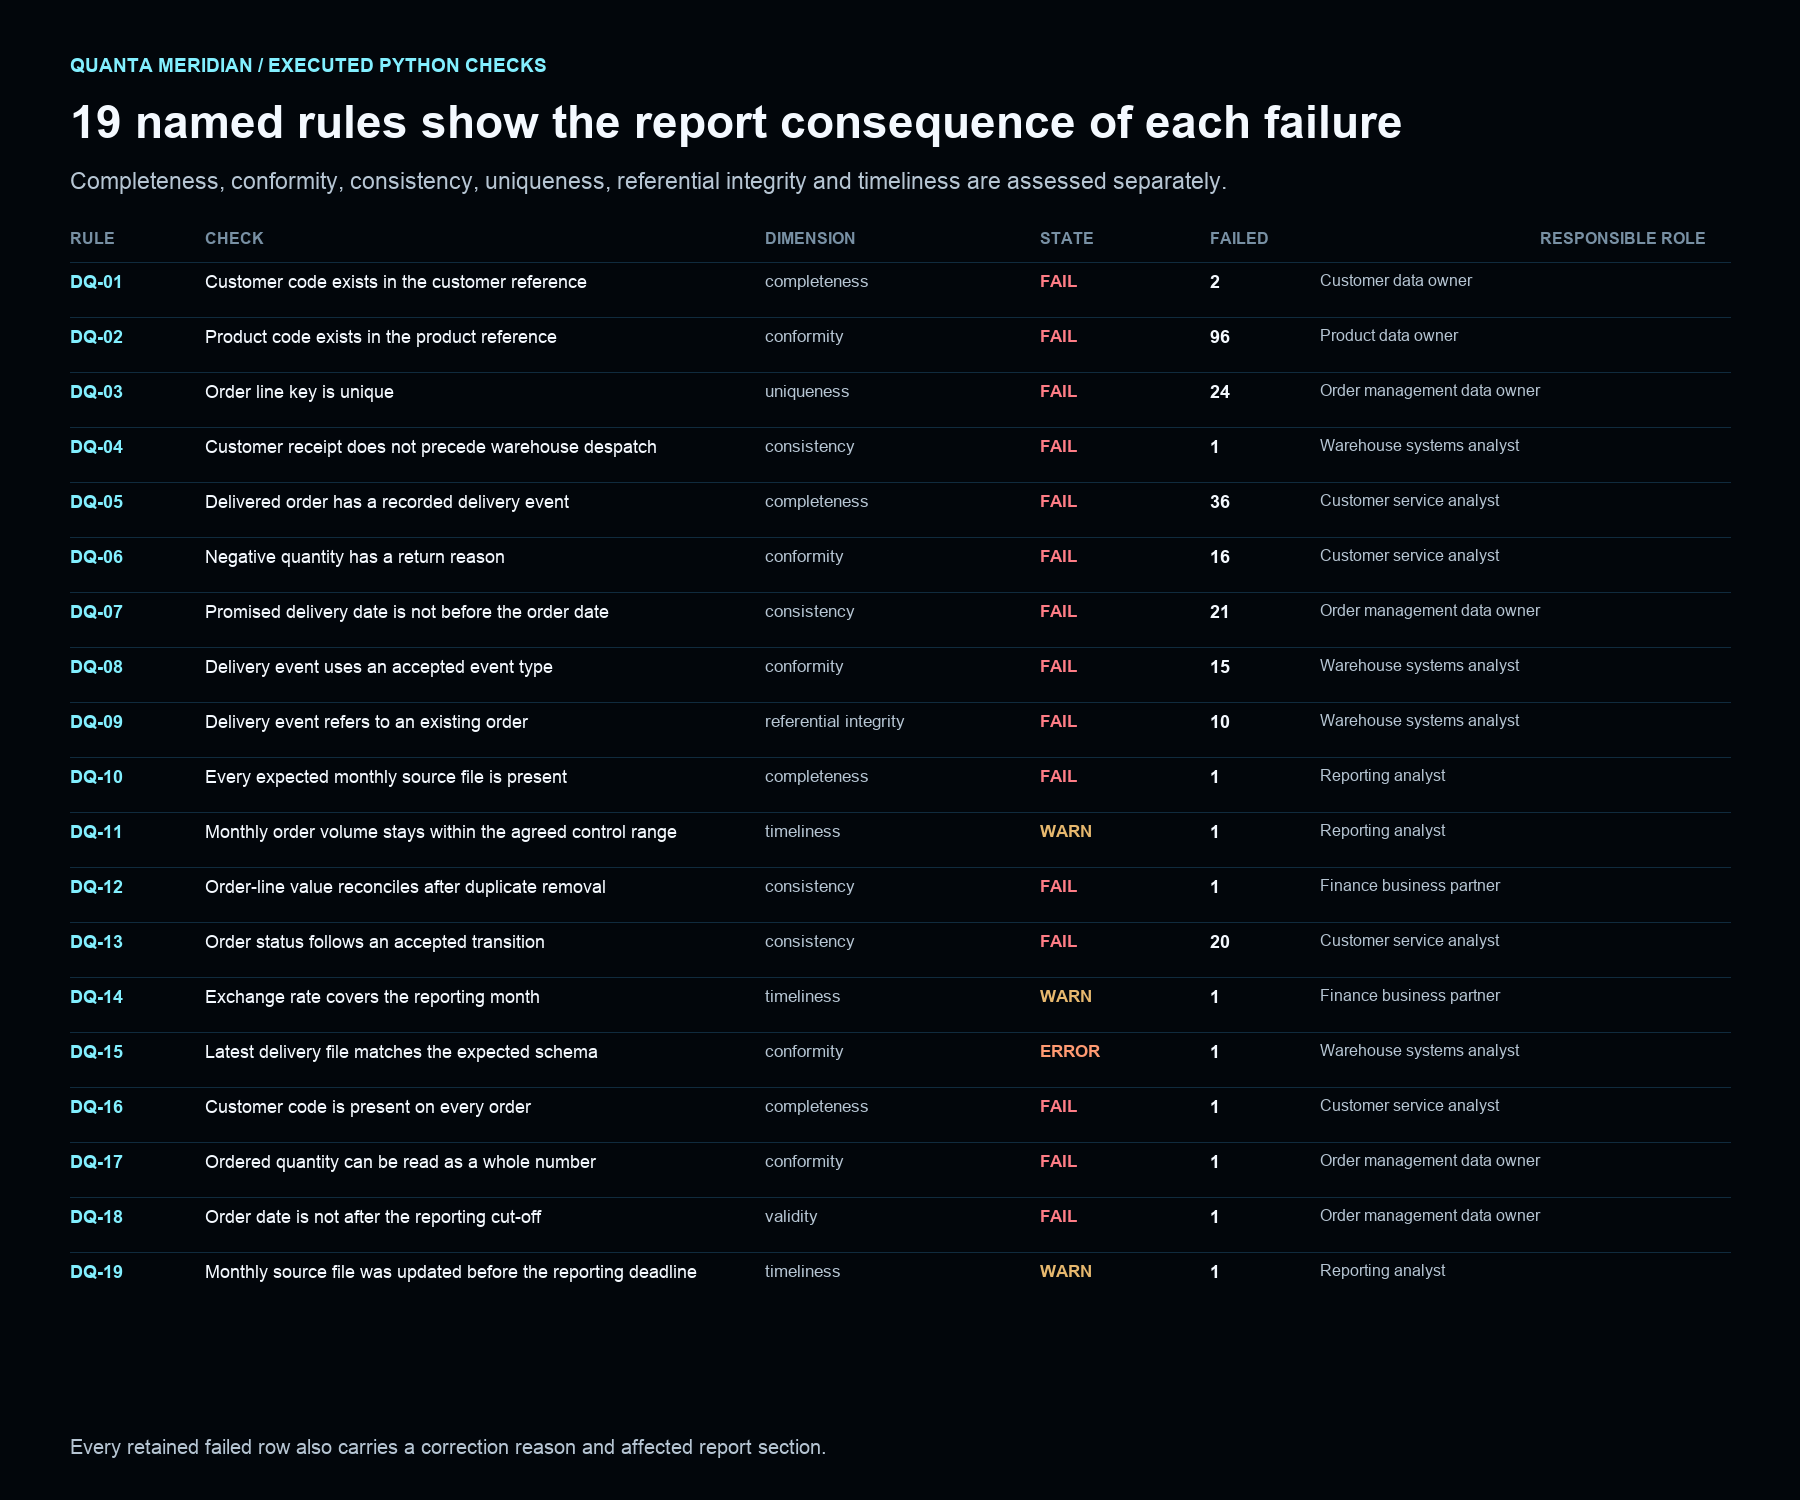
Order and Delivery Data Quality Checks
A repeatable set of checks that stops incomplete or contradictory order records from entering the monthly service report and gives each failed row a specific correction reason.
Inspect the projectExcel and Power Query
Excel and Power Query are used when people need a familiar workbook without hiding file intake, transformation logic, adjustments or checks.
See how Excel and Power Query is used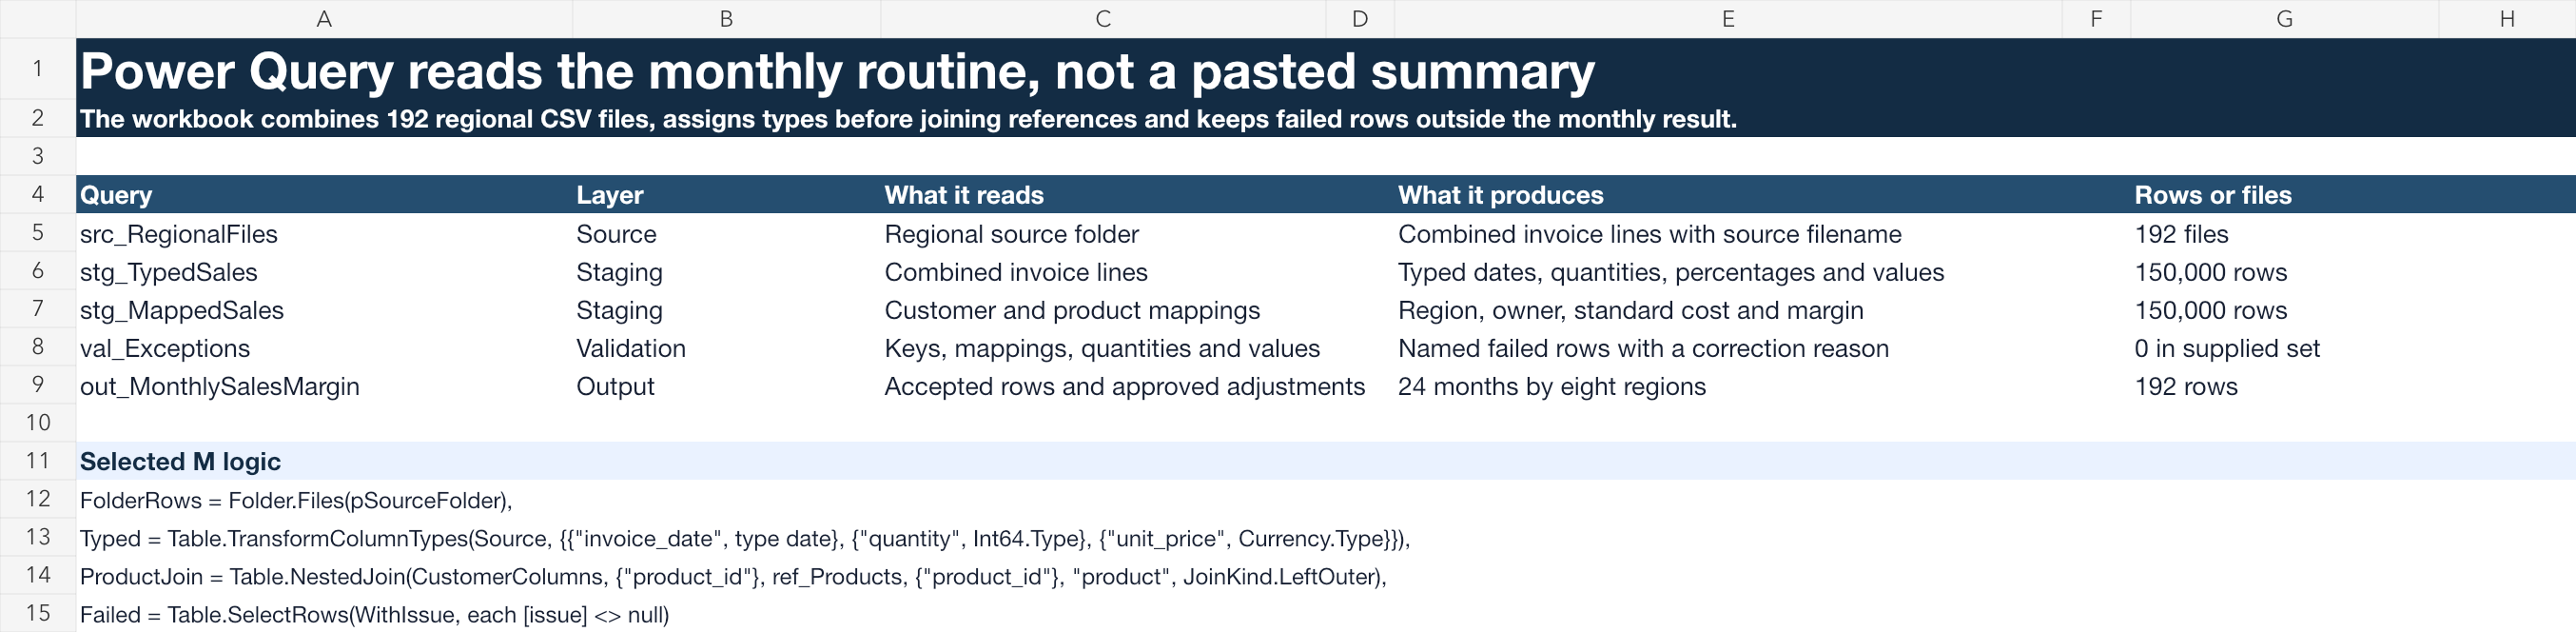
Monthly Sales and Margin Workbook Rebuild
An Excel and Power Query rebuild that replaces the monthly copying of regional sales files with a repeatable refresh, visible adjustments and a checked sales and margin pack.
Inspect the project