Name the decision
Define the meeting question and the people who must answer it.

Power BI
For finance, operations, workforce and assurance teams that need shared measures and a clear route from a headline to the record requiring attention.
Quanta Meridian prepares the data, builds a shared model that holds relationships and measures, writes explicit DAX and checks the result against retained source totals.
What should a reviewer be able to decide, and which model, measure and drill path will support that decision?
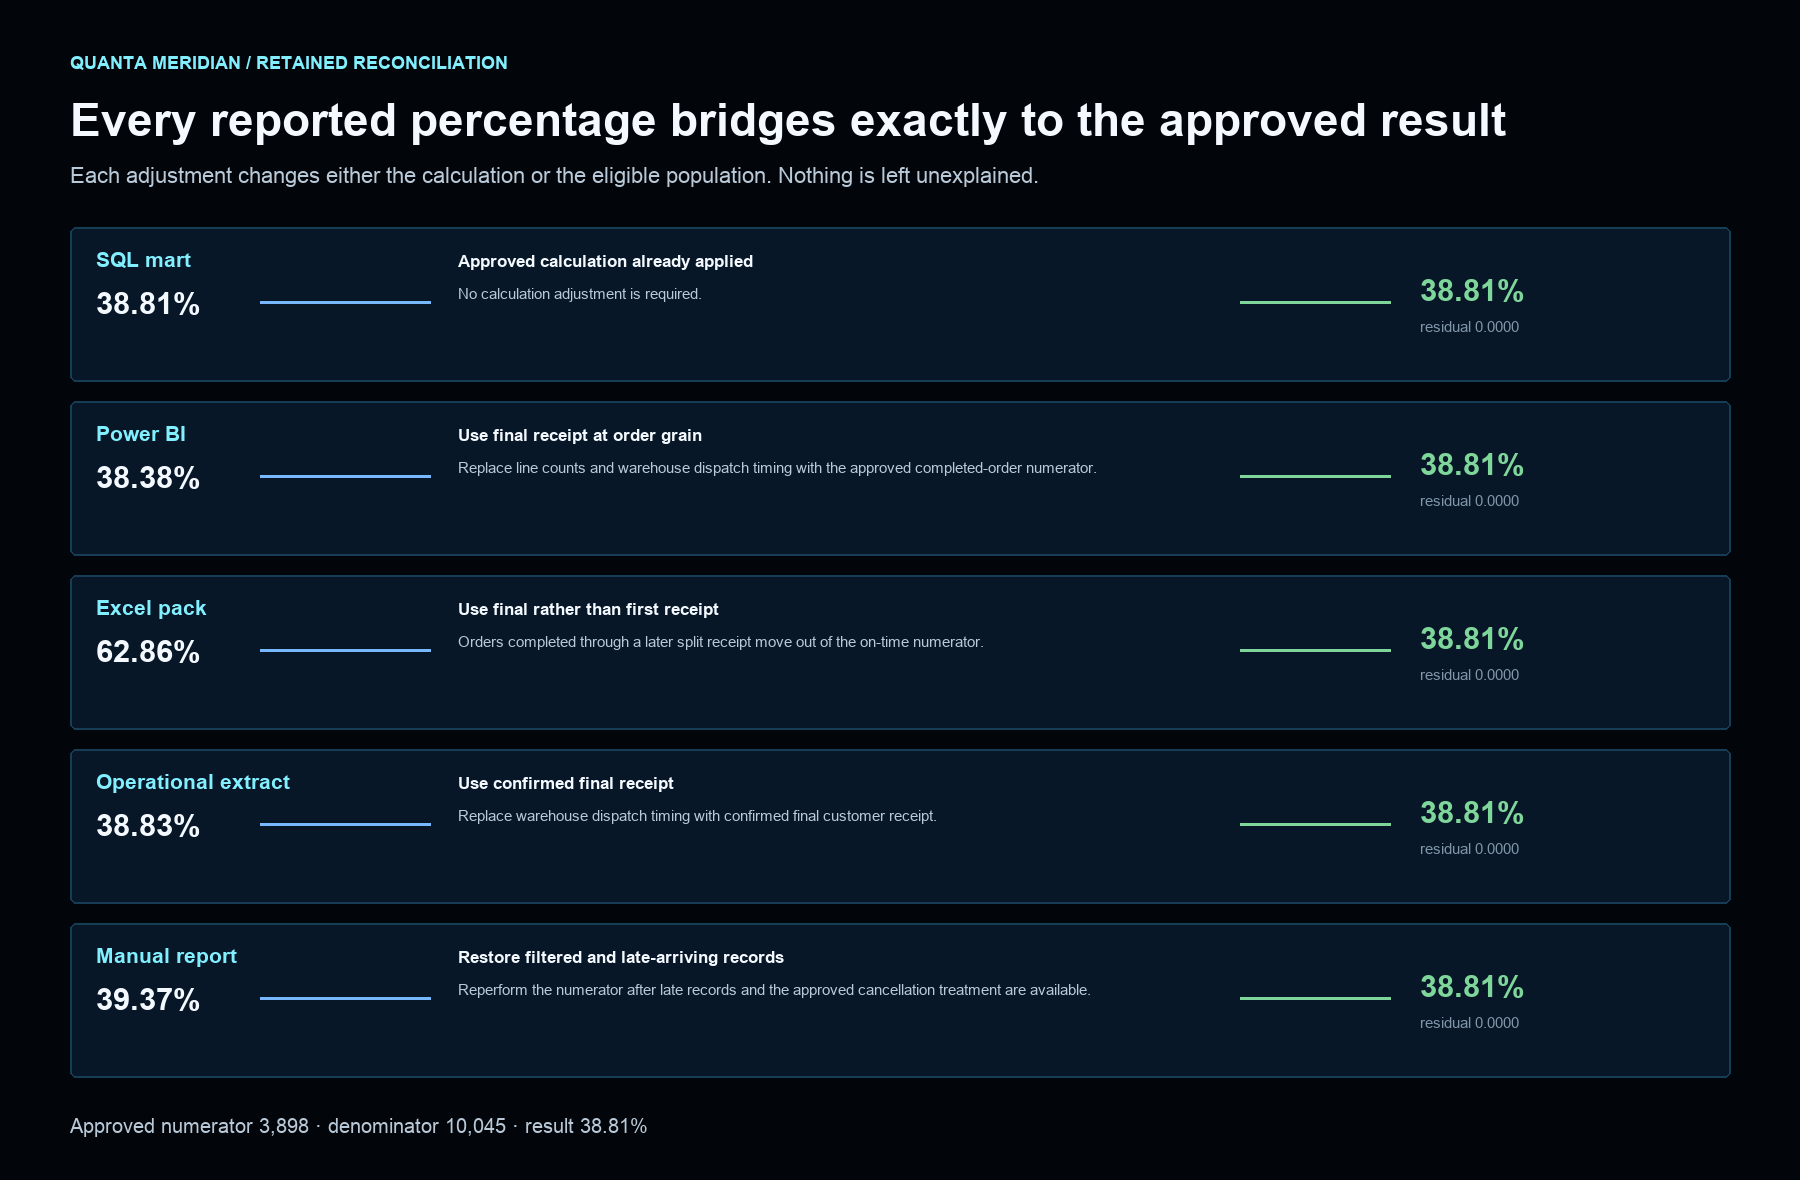
Inspect the project evidenceThe reconciliation project shows one Power BI measure alongside SQL, Excel, an operational extract and a management pack. Each implementation is recalculated from retained records and bridged to the approved definition. This public example proves the DAX reference and numerical bridge; it does not claim or offer a native Power BI report.
Define the meeting question and the people who must answer it.
Keep assessments, events, ledger entries or workforce snapshots at a consistent level.
Use explicit DAX for populations, time logic, exclusions and scenarios.
Move from overview to exception and then to the underlying record.
Tie totals to source data and check refresh, performance, accessibility and security.
Facts contain the events or observations being measured; dimensions provide the dates, controls, suppliers, accounts, roles or locations used to filter them. Explicit measures then state how the population, period and exclusions are handled.
That structure matters when a reviewer drills from a quarterly readiness total to one control, or from a full-year margin movement to the utilisation assumption that changed it. The page does not have to repeat the calculation because the model owns it.
The retained projects include PBIP or PBIX build material, Power Query, DAX, validation outputs and native screenshots where available. A screenshot proves that a report page existed at capture time; it does not prove the refresh, security or every calculation on its own.
Totals are therefore checked outside the visual layer, and project pages state whether a native capture belongs to the current model or an earlier report iteration.
Readable project evidence
From On-time Delivery Metric Reconciliation. Calculation, event-date, record-grain and extract-population adjustments bring every reported version to the same numerator and denominator with no residual.
Evidence type: Rendered from retained project records
Used in public projects
These links cover the complete set of current projects that use this capability. Each project states its data, native build, validation and limitation.
The Power BI result differs from SQL, Excel and the management pack.
The report implementation is independently recalculated and corrected to use the approved metric definition.
The retained bridge explains the exact numerator and denominator adjustments.
Working boundary
Power BI cannot repair missing records or settle disputed definitions by presentation alone. Source preparation, measure ownership, refresh controls and release decisions remain part of the reporting system.
Bring the question the report must answer, one disputed measure and the source used to calculate it. A useful first review starts with the model, not the colour palette.
Discuss this capabilityReturn to all capabilities