Which facilities need attention before the next review?
PBIX quanta-meridian-compliance-portfolio.pbix8 report pages available to inspect.Read the report story and browse all 8 pagesSolution Example collection 05
Four working reports support four different decisions: facilities and compliance, forecast margin and scenarios, purchase-to-pay process intelligence, and reporting governance and data quality.
Open the fanned previews to inspect every retained Power BI Desktop page. Each report shows its retained pages, remaining performance work and limits on use.
Power BI report examples
Each fanned preview shows pages from one of the 4 working files. Choose a report to read its story, inspect every retained Power BI Desktop screenshot and open any page at full size.
Facilities and compliance
What this report is for
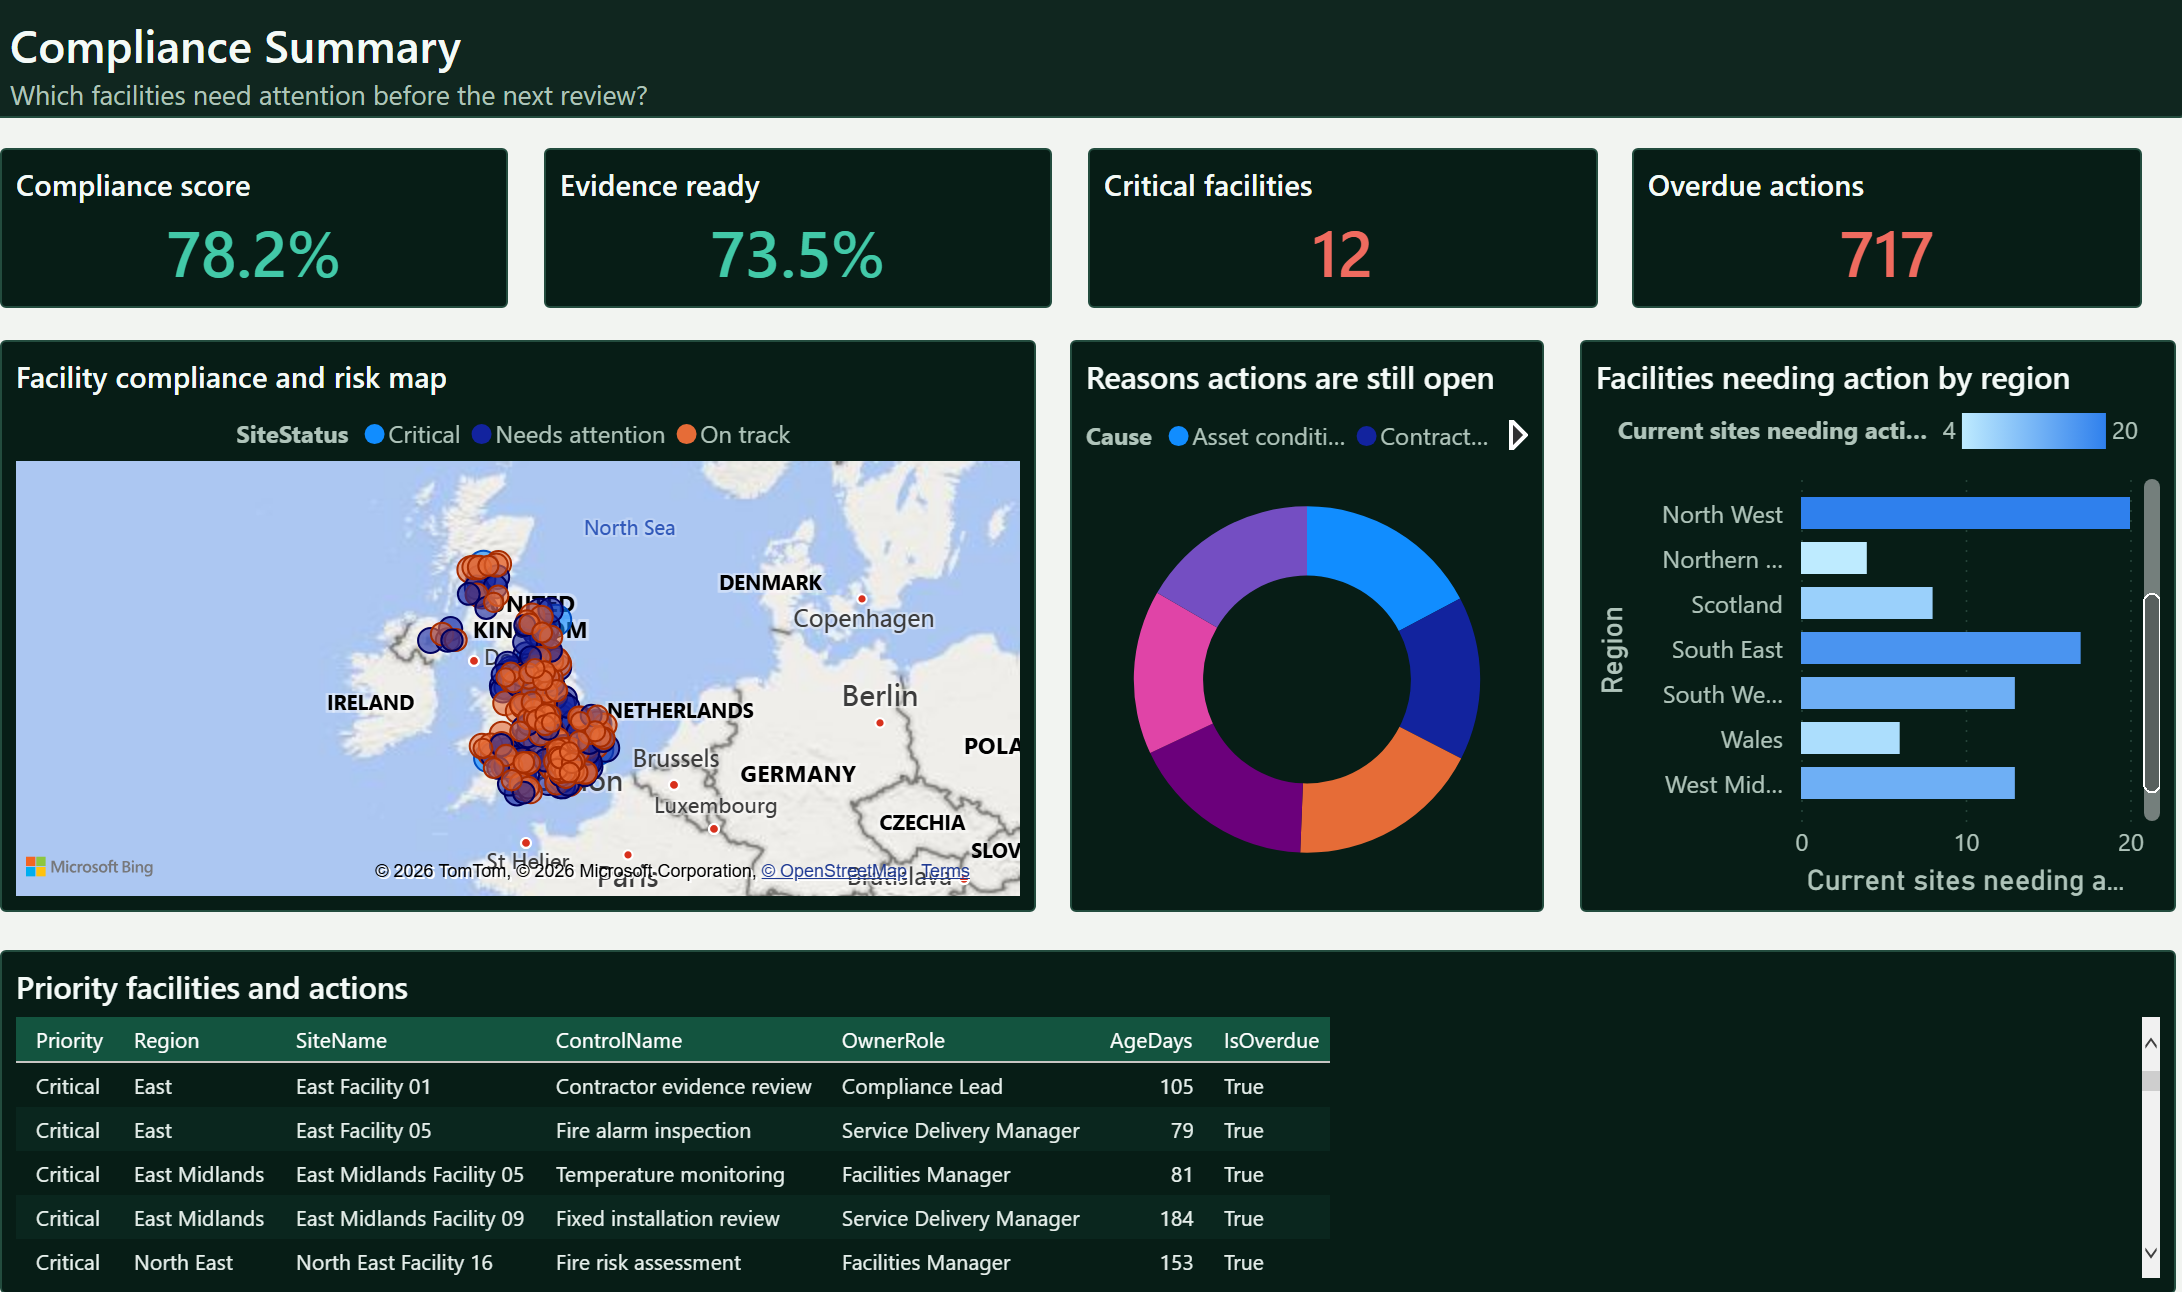
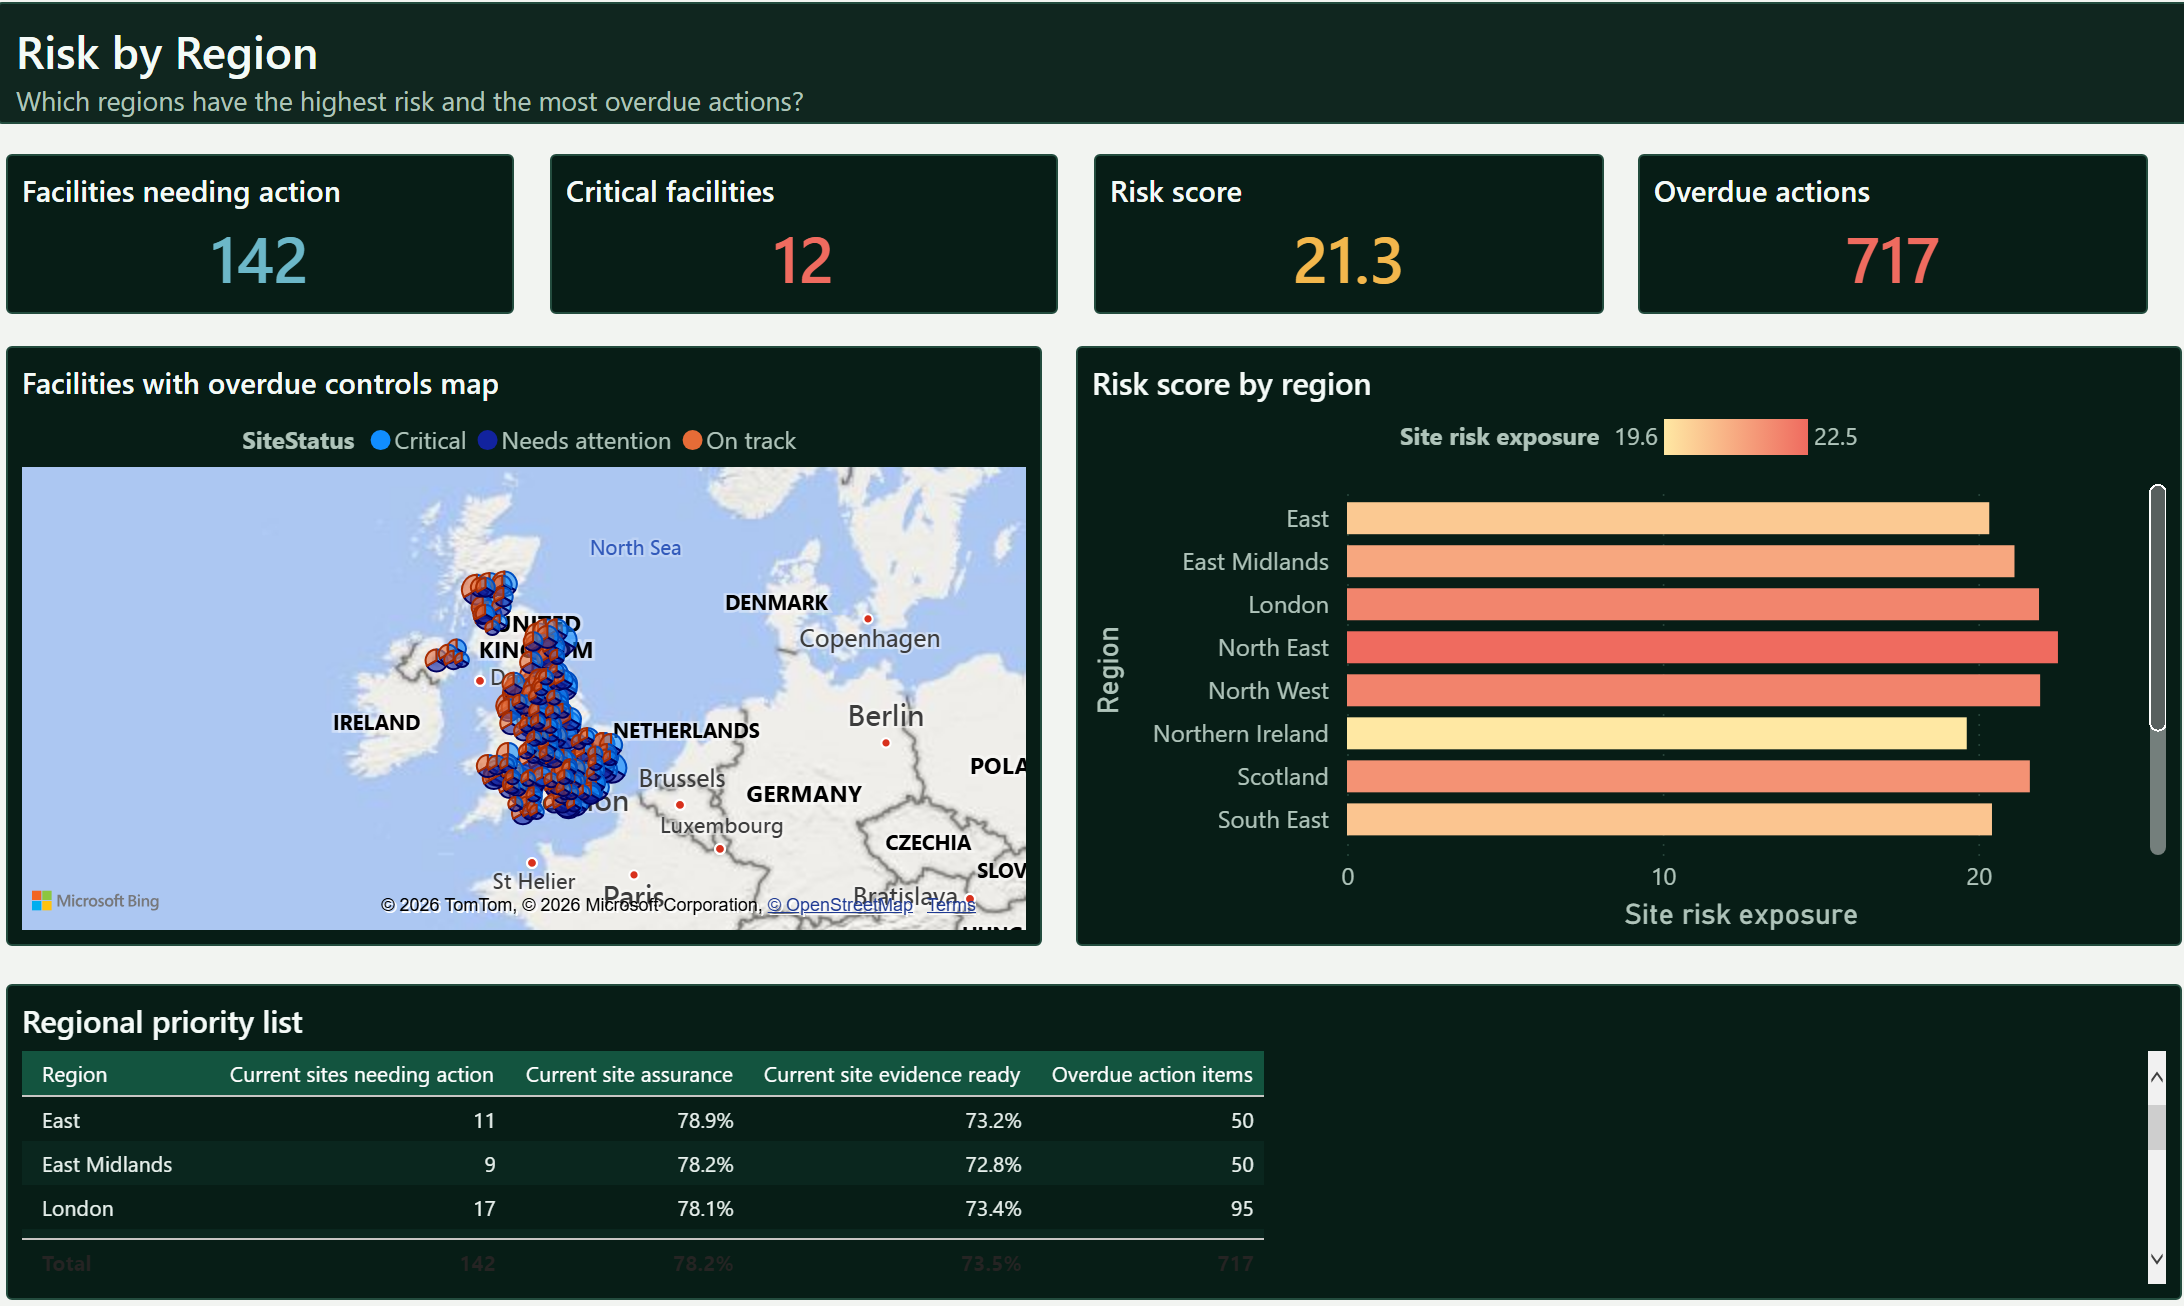
Eight pages show the current facilities position, where problems are concentrated, which actions are overdue and who needs to respond.
The summary shows the scale of the review: 300 facilities, 10,800 inspections, 3,600 current evidence rows and 1,448 open actions. It helps the reviewer decide where to look first without treating the overall score as the whole answer.
Separate pages cover movement over time, regional risk, inspection failures, missing evidence and overdue actions. That matters because an improving headline can still hide a large backlog in one region or a weak control area.
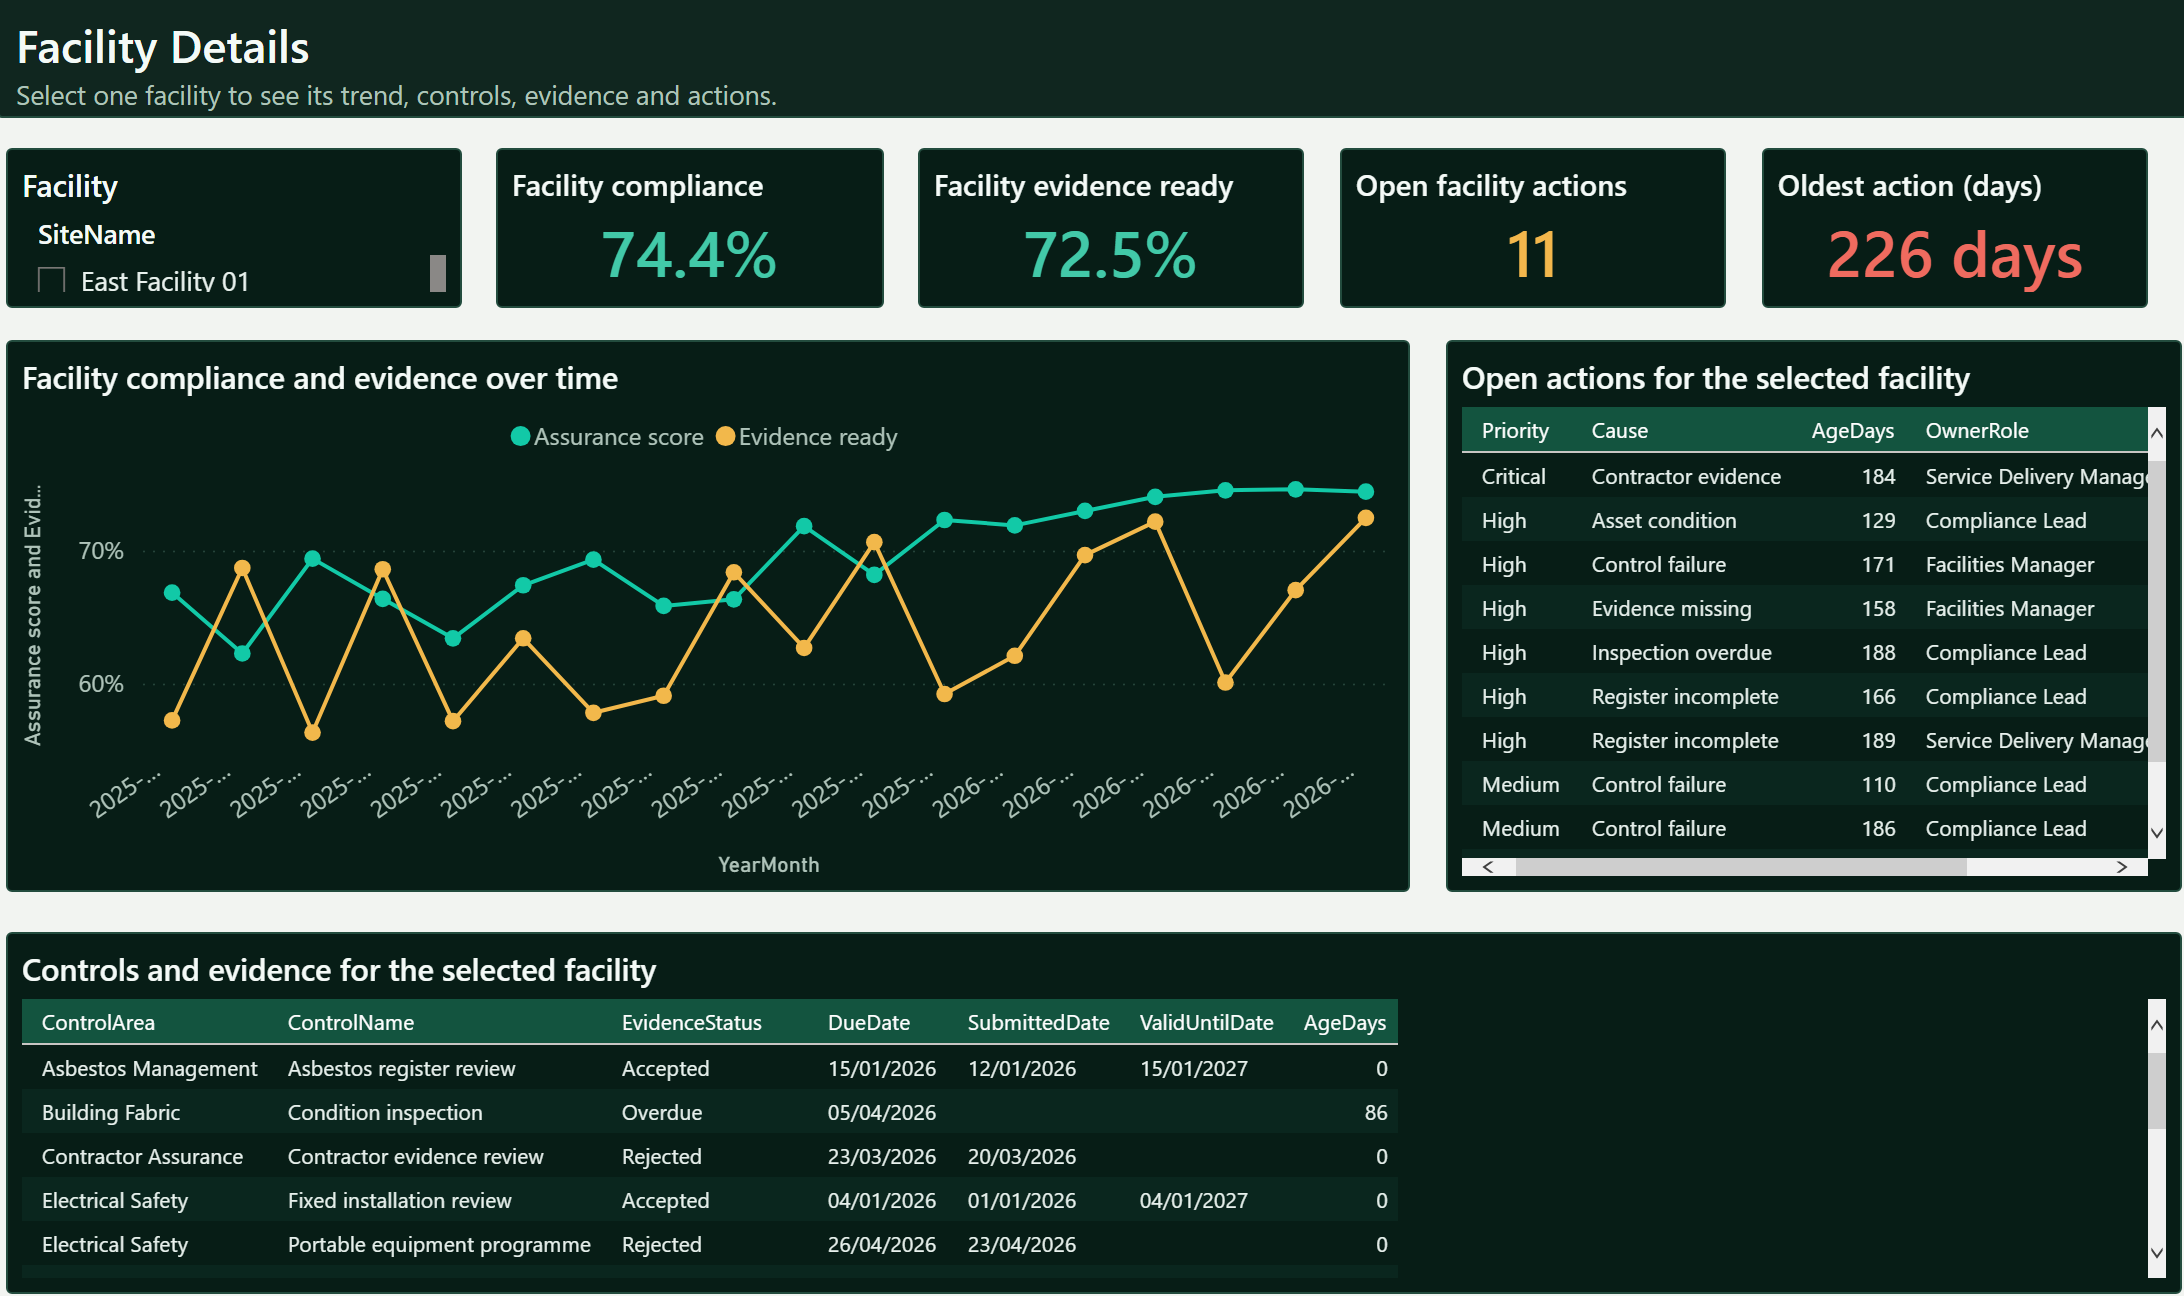
The final operational page opens one facility so the reviewer can see its open actions, supporting records and responsible roles. The report then shows the data model, measure definitions and checks used to calculate the totals.
What the example shows
The working PBIX file contains eight connected pages, individual facility details and visible calculation checks. It uses example data and has not been refreshed or tested for performance in a client environment.
Page 01 of 8
Forecast margin and scenarios
What this report is for
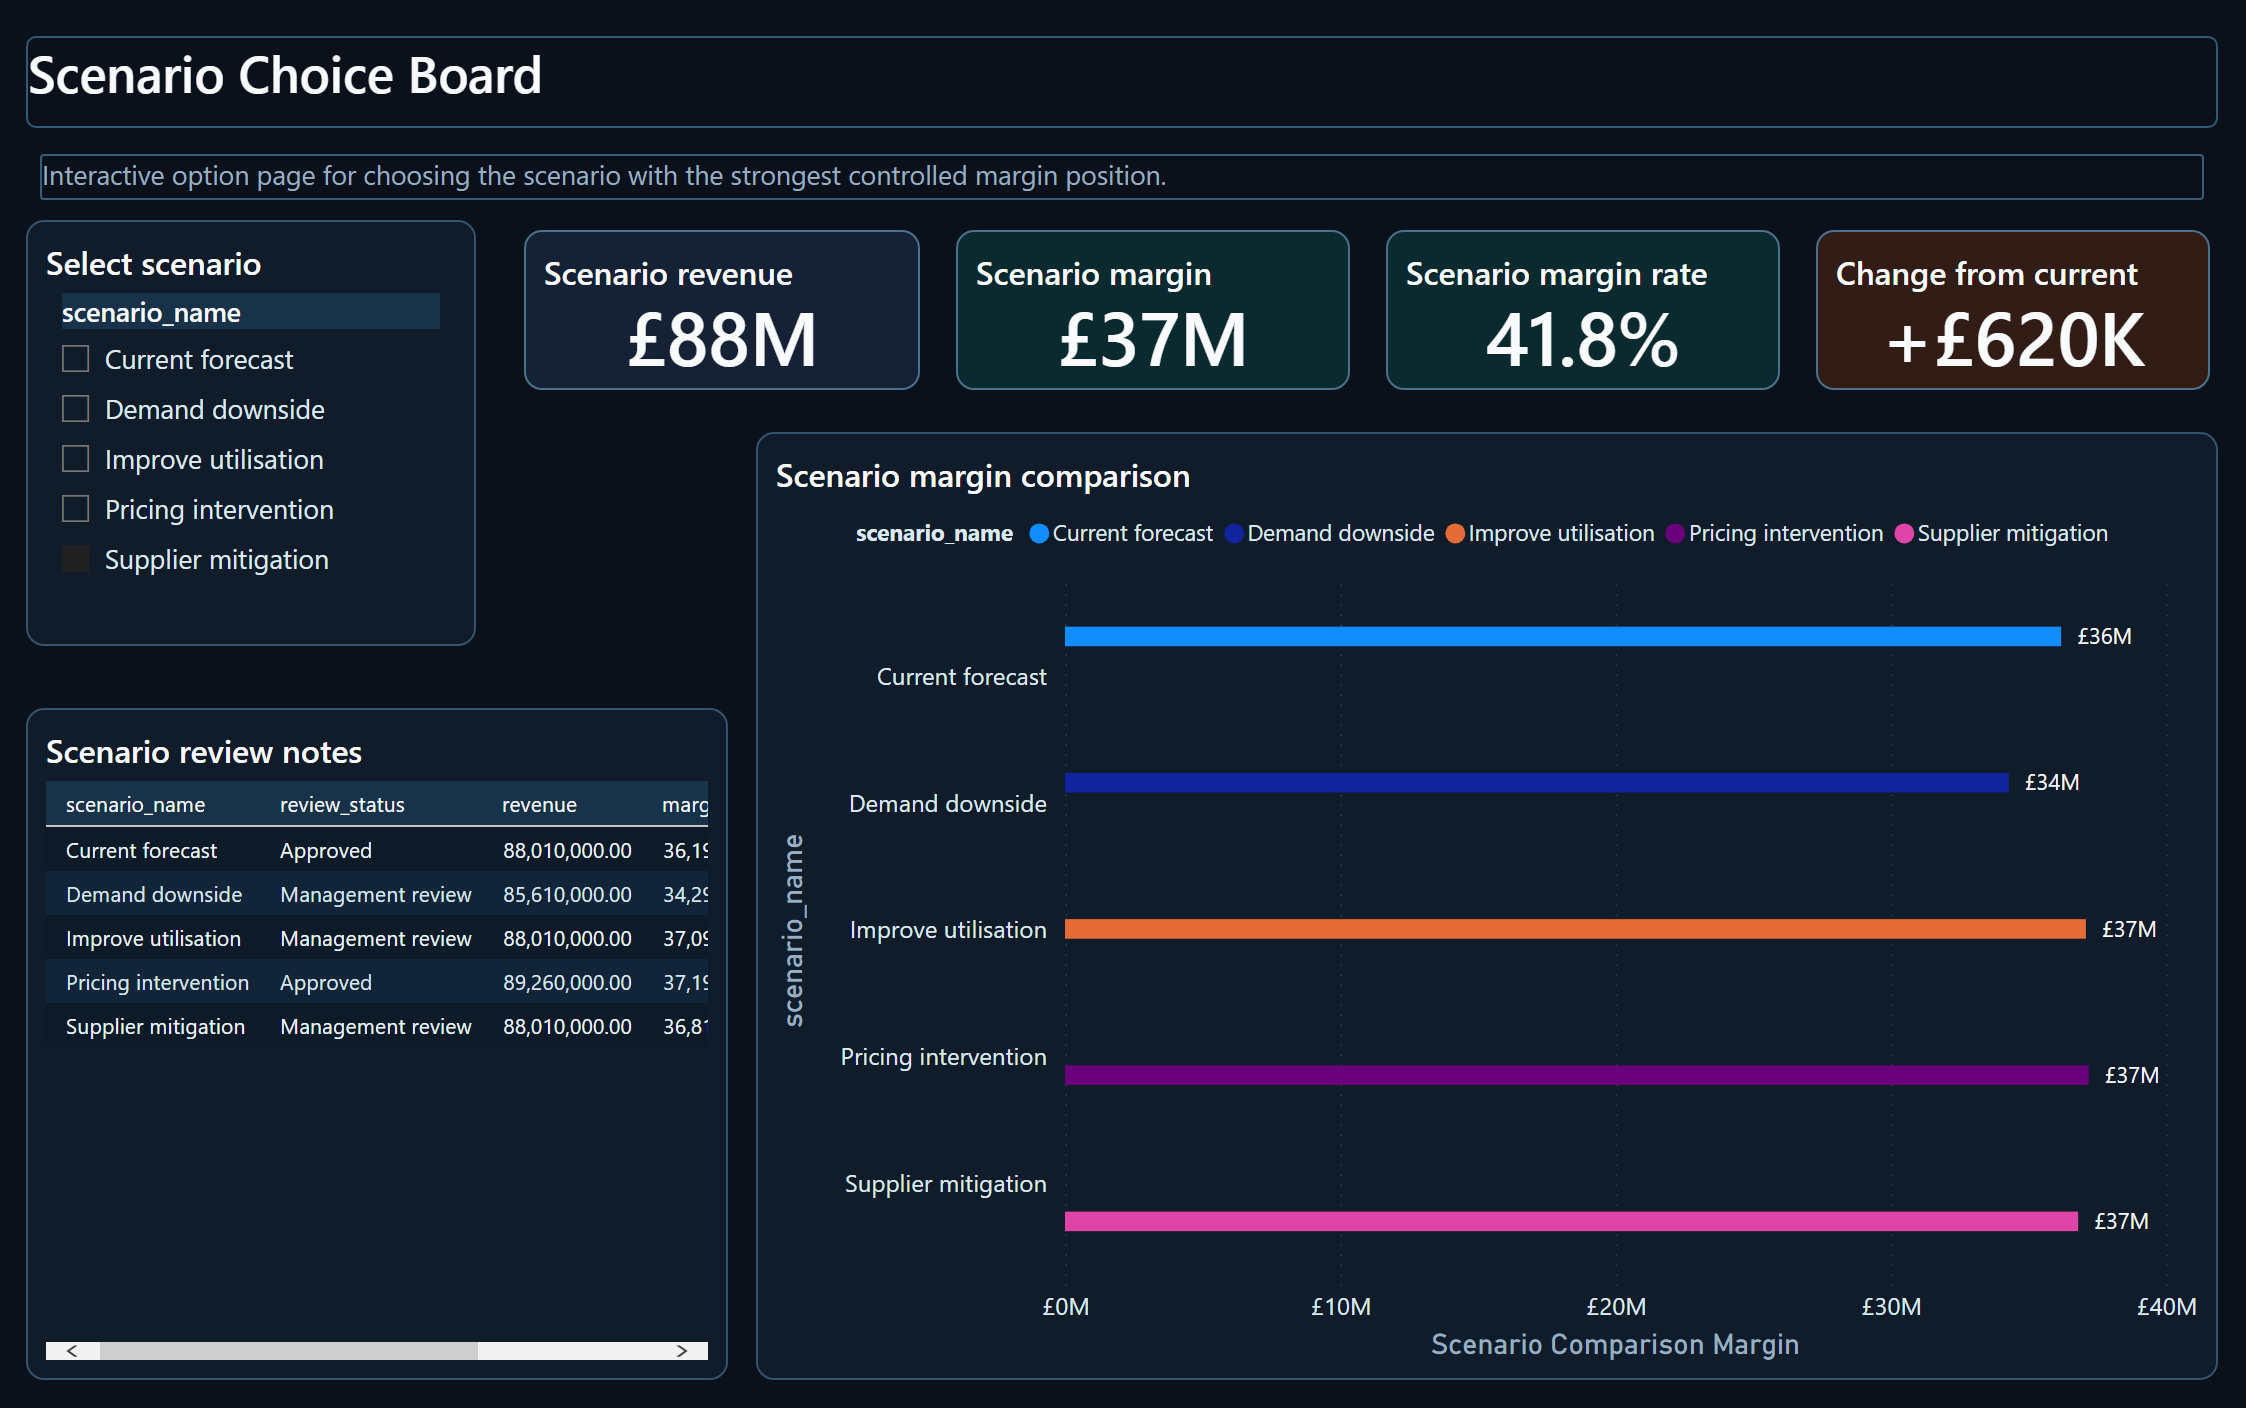
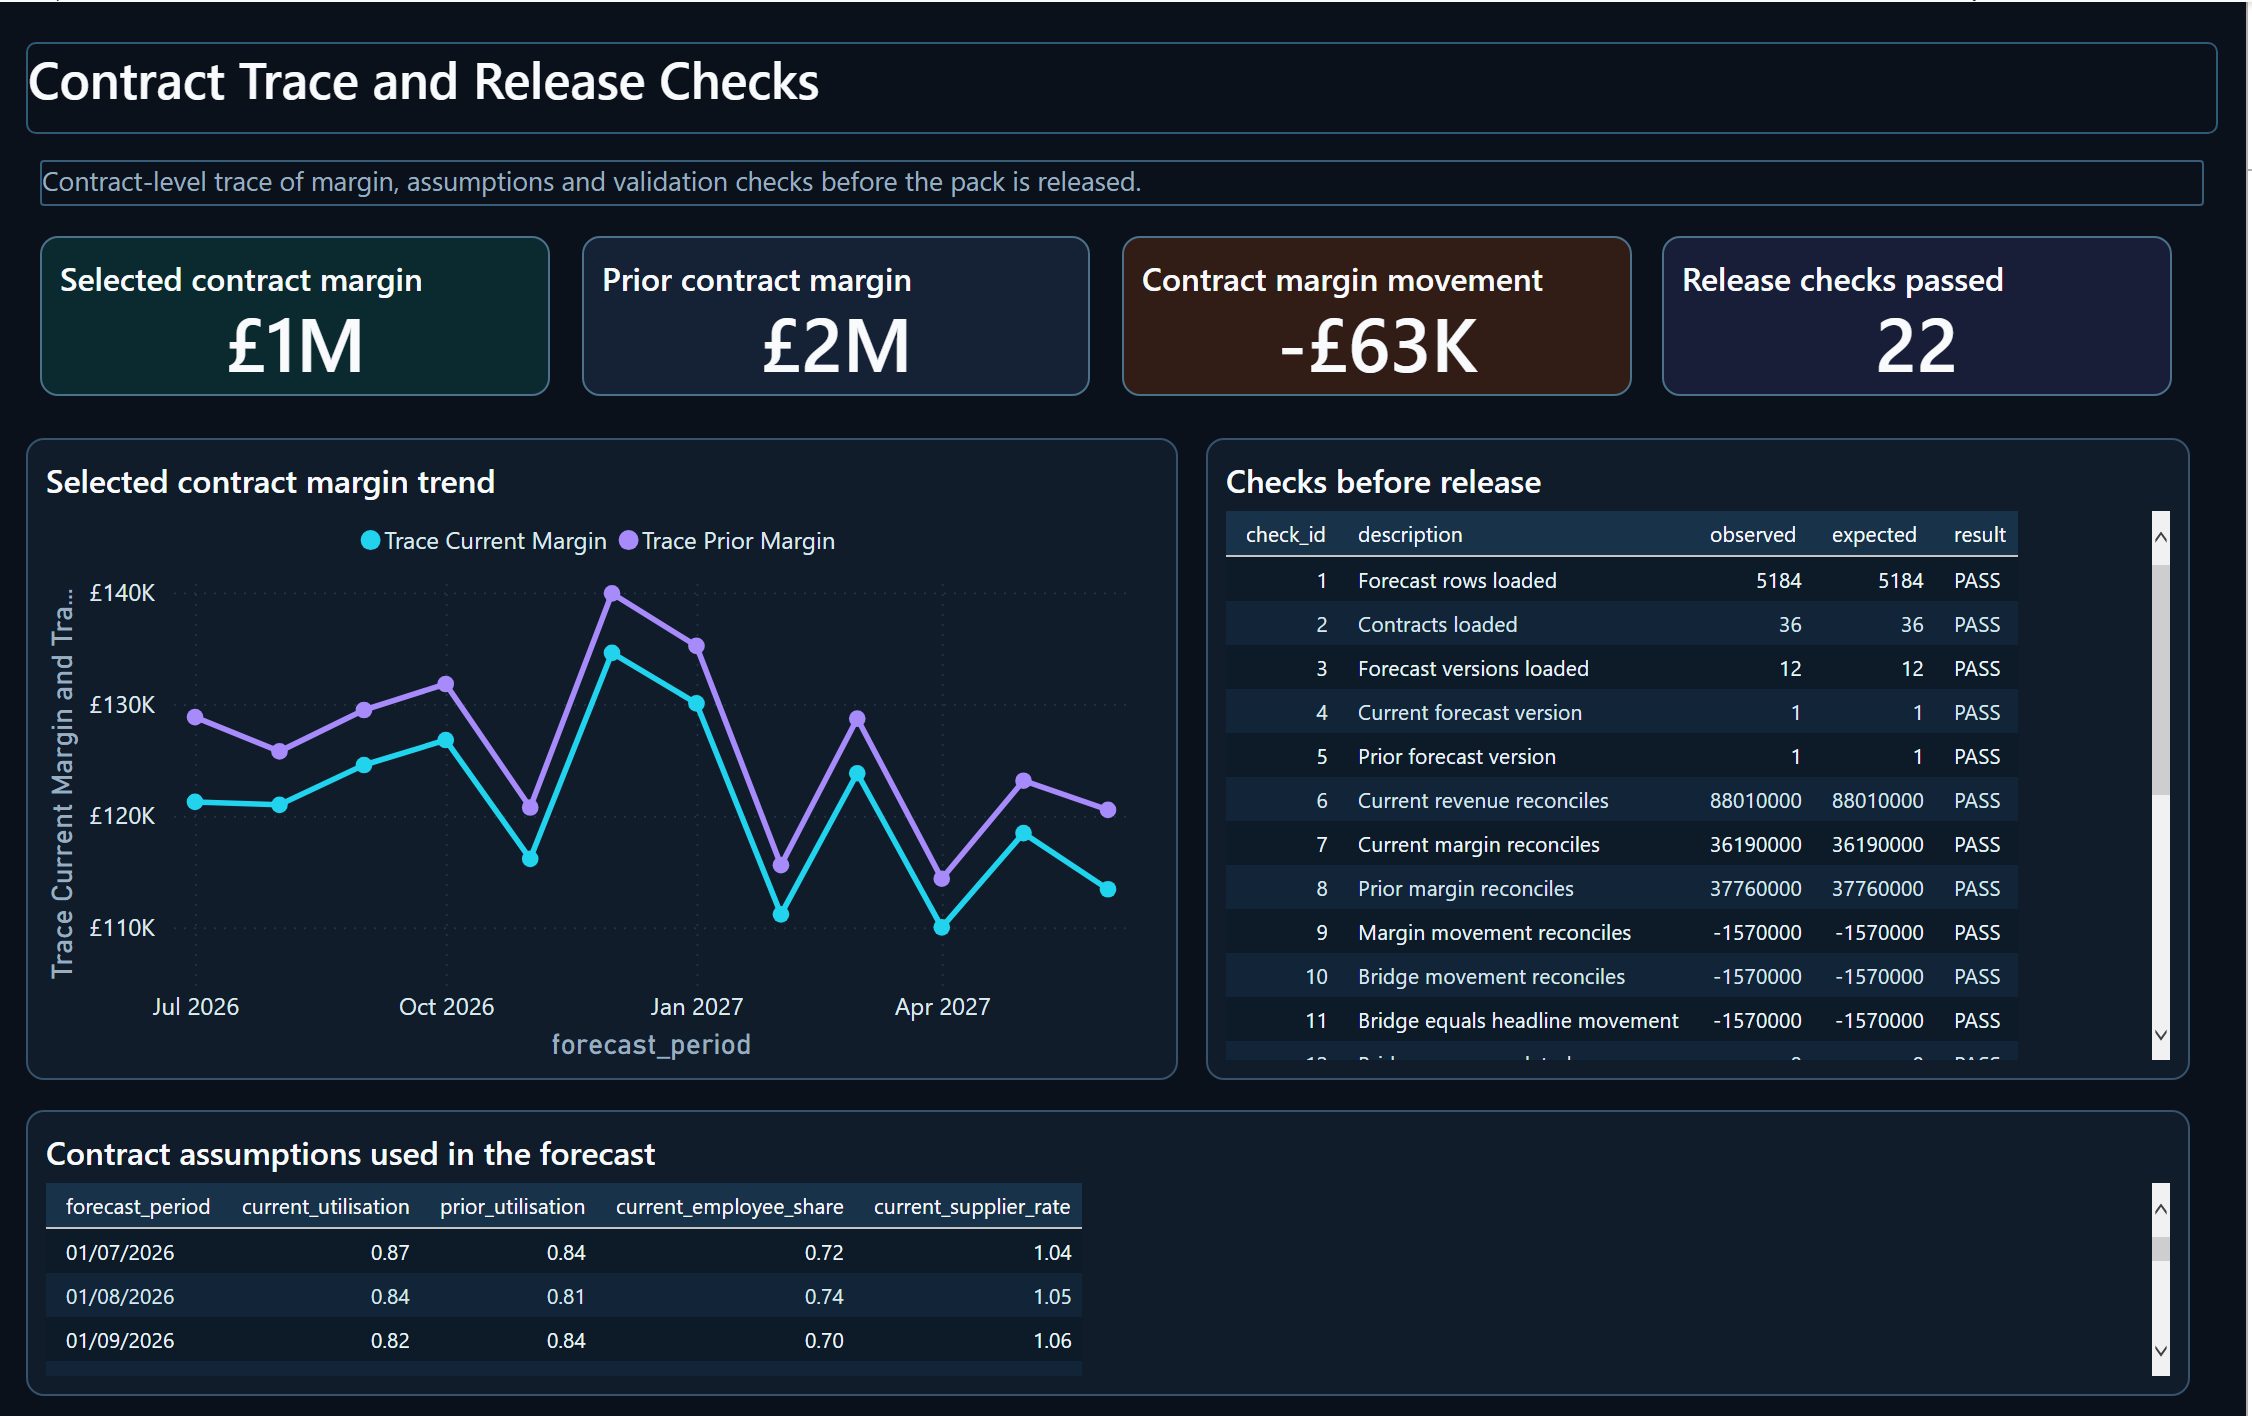
Five pages explain the current margin, the drivers of the decline, how the forecast changed, which options were tested and what happened on one contract.
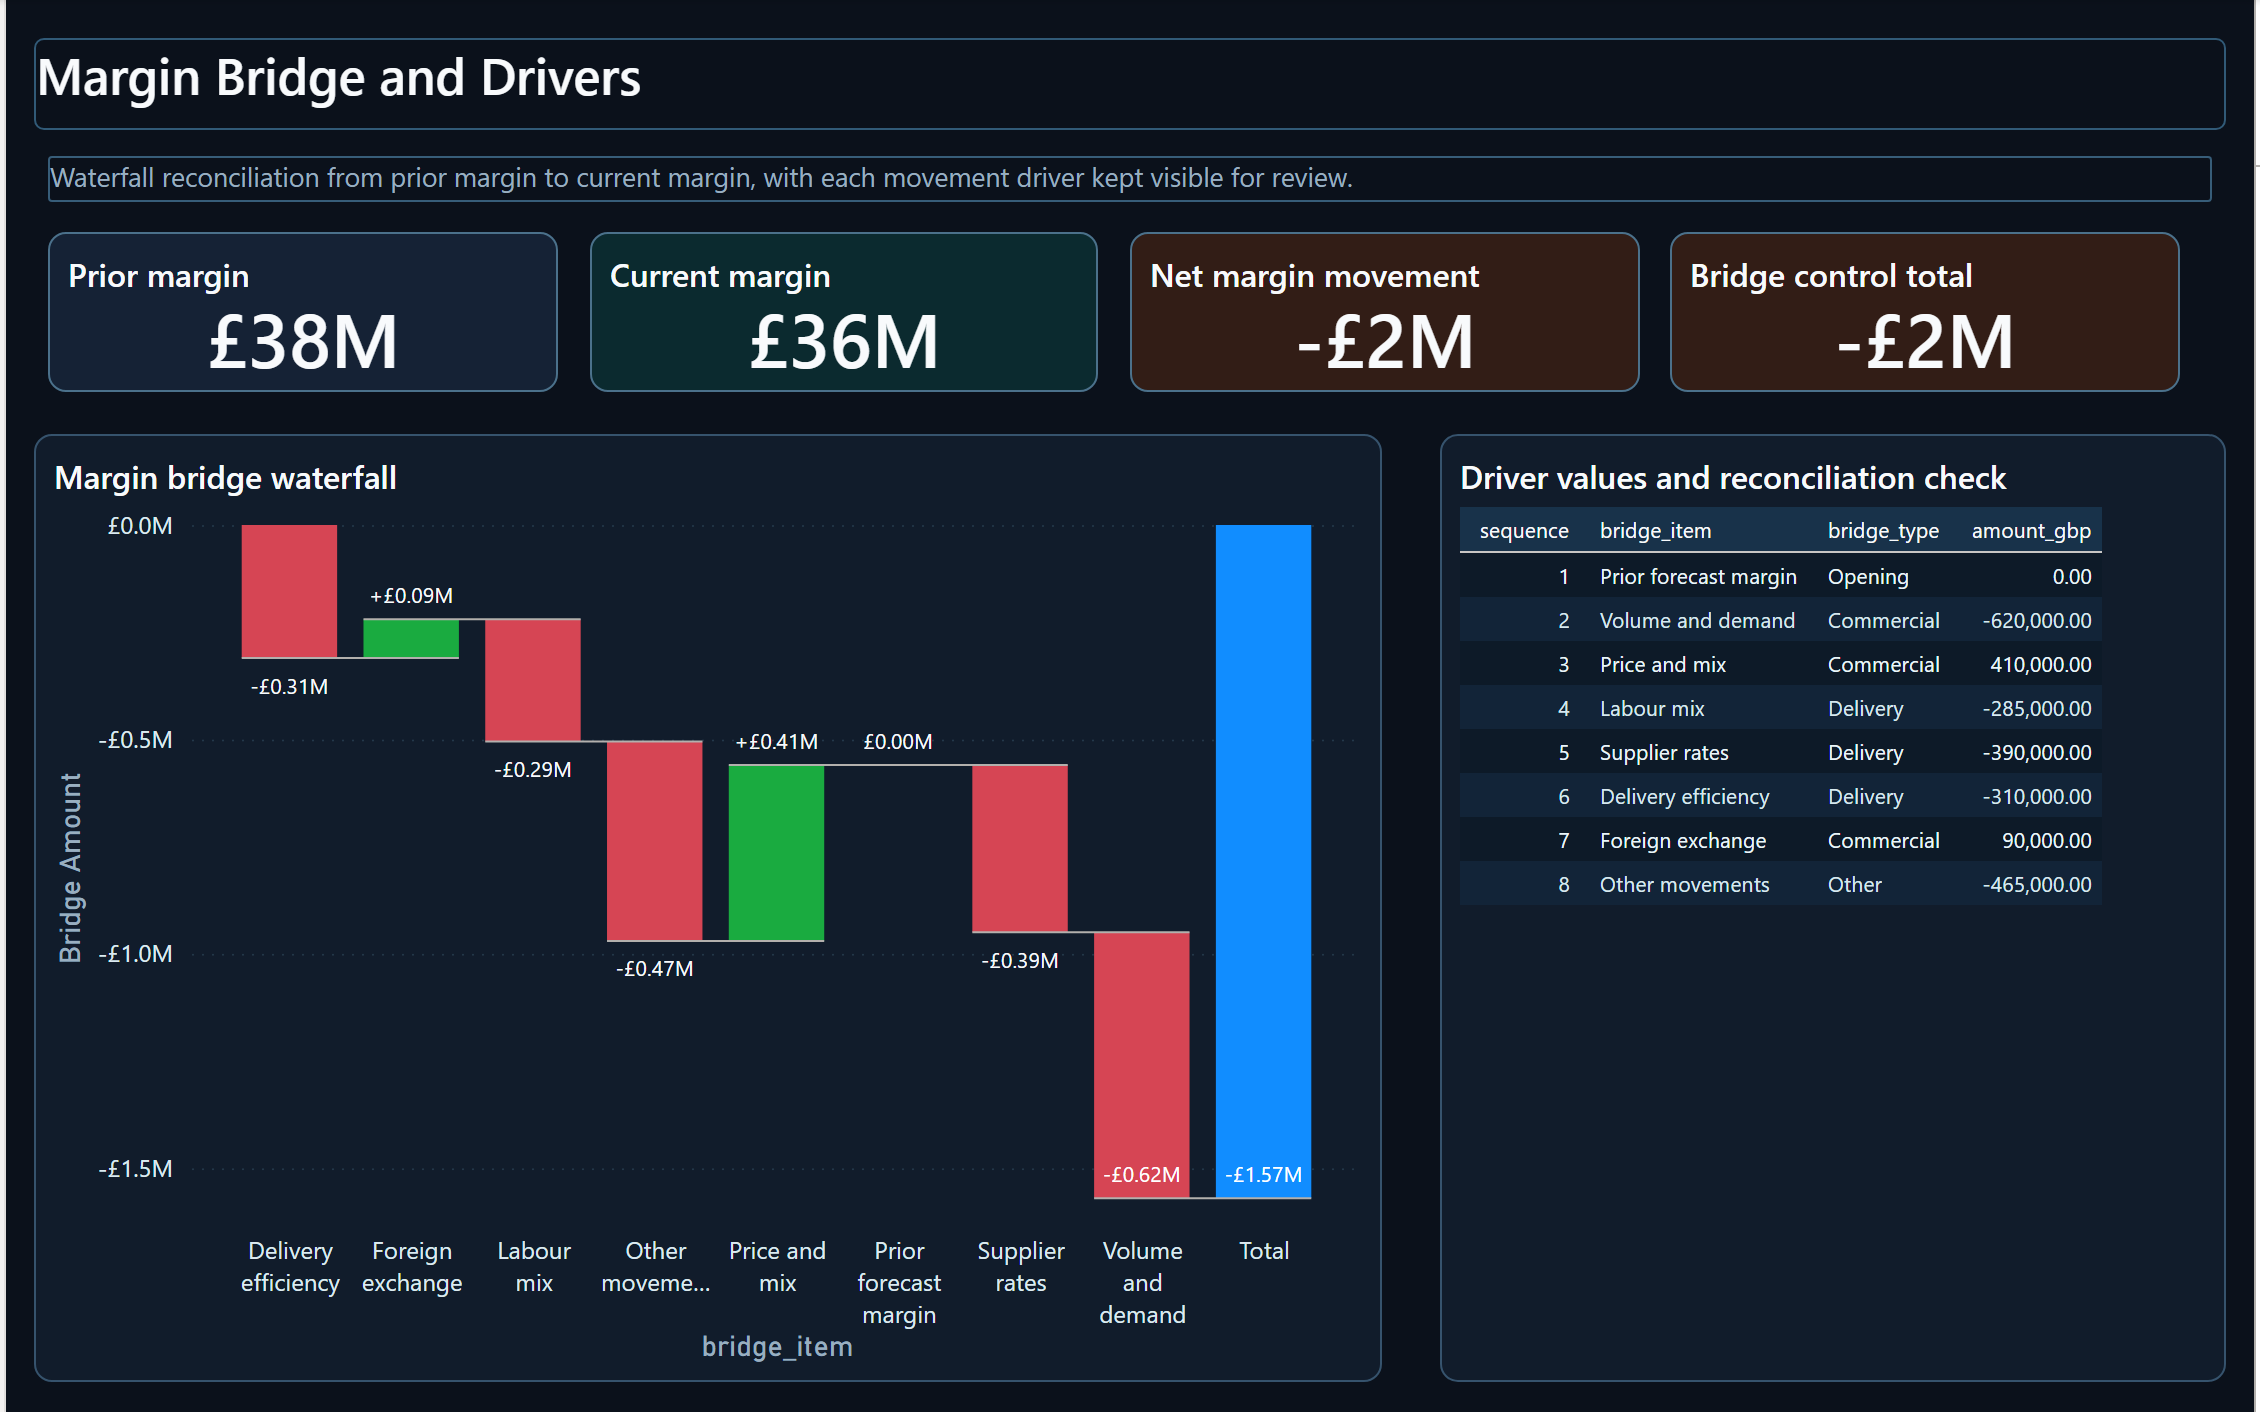
The current forecast holds about £88.01M of revenue and £36.19M of margin, a 41.1% margin rate. Margin is £1.57M below the prior forecast, so the review question is not simply whether the number moved but which assumptions and contracts explain it.
The detailed bridge attributes £2.07M of adverse movement to volume and demand, supplier rates, delivery efficiency, labour mix and other movements. Price and mix plus foreign exchange recover £0.50M, leaving the £1.57M net decline confirmed by the report checks.
Version history shows that the latest movement follows a longer downward revision path. The scenario board keeps the current forecast visible while comparing specific options. The selected supplier mitigation case adds £620K of margin but does not recover the whole decline.
The final page examines one contract: current and prior monthly margin, operating assumptions and 22 passing checks. Exact tables carry the reconciliation because the headline cards deliberately round to whole millions.
What the example shows
The detailed bridge, version history, scenarios and contract page explain the £1.57M movement. The summary waterfall does not agree with that bridge and needs to be corrected before the report is shared.
Page 01 of 5
Purchase-to-pay process intelligence
What this report is for
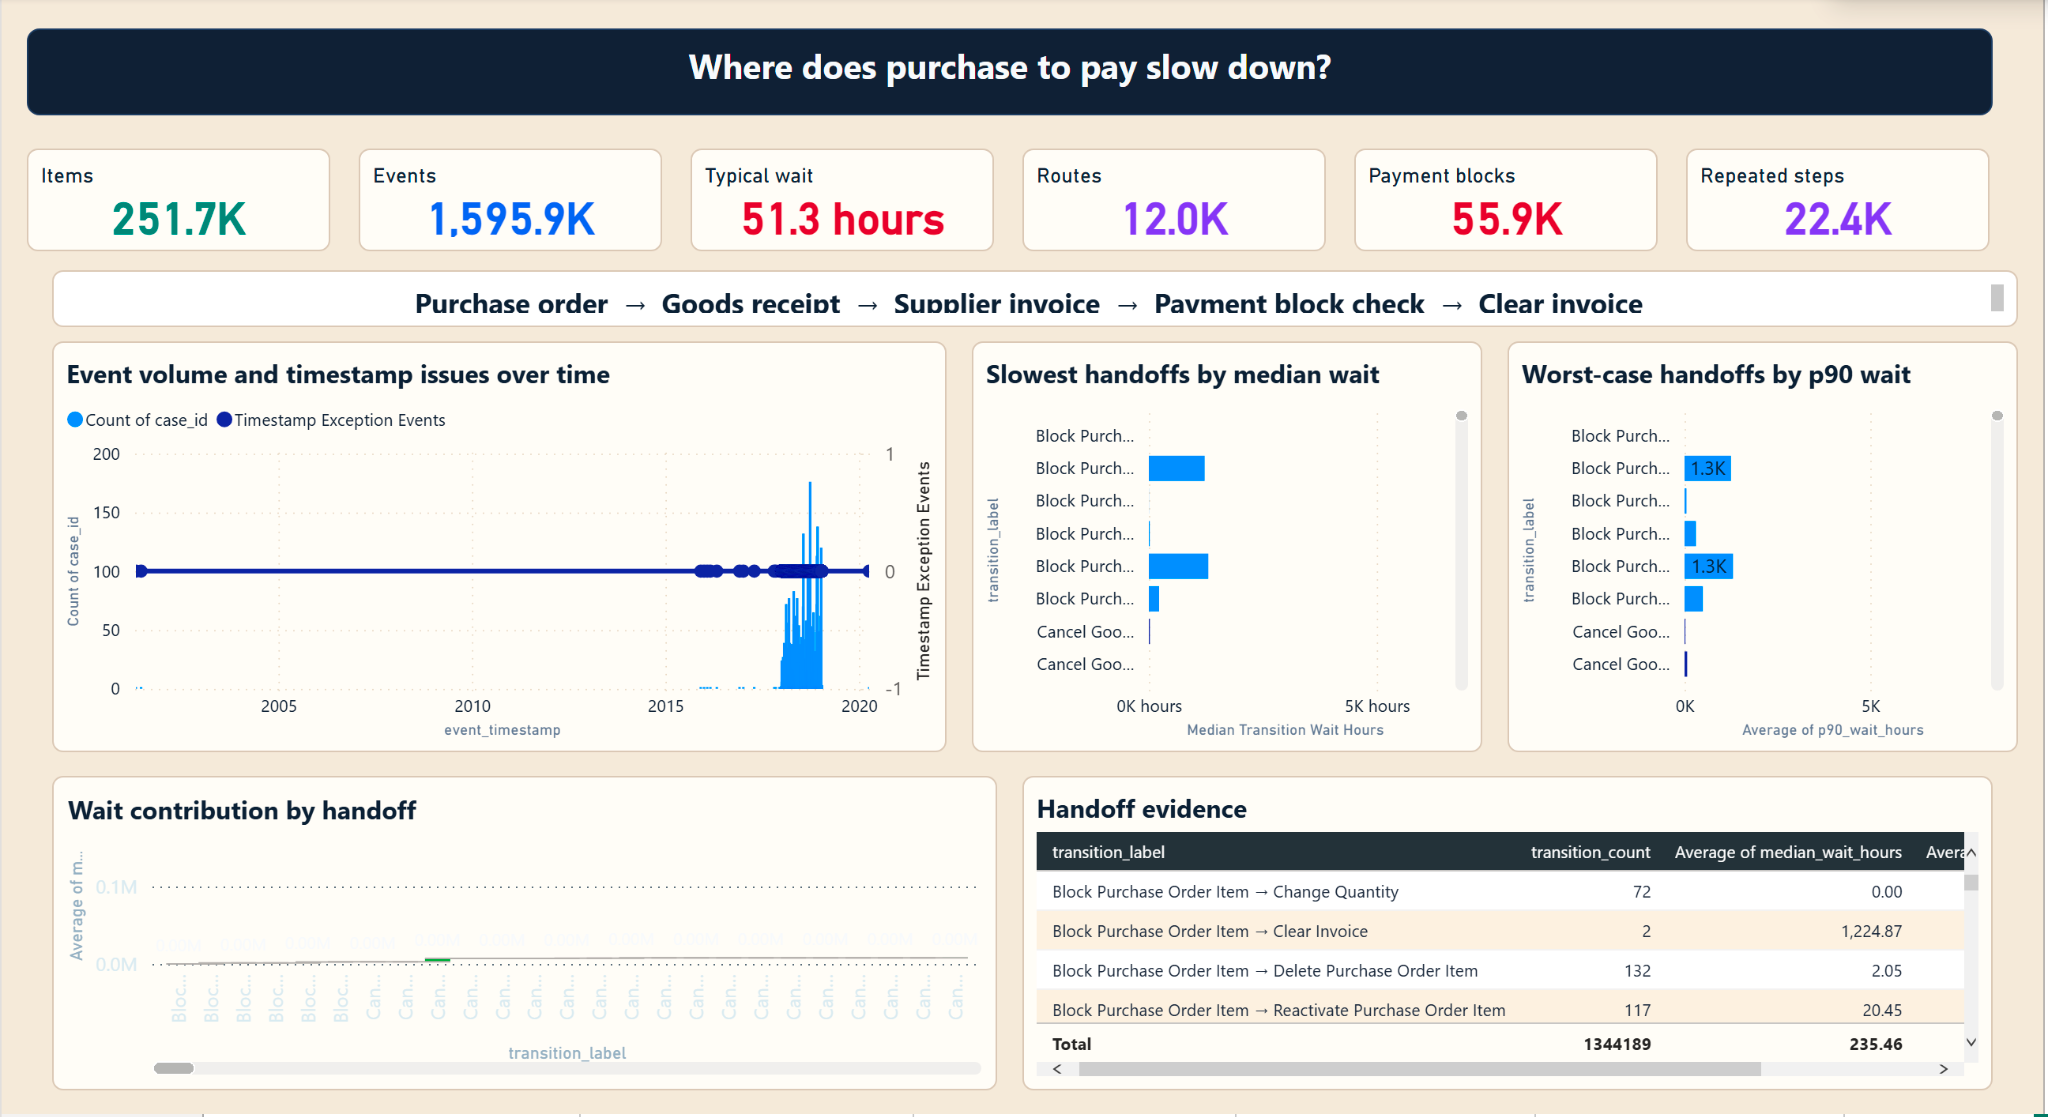
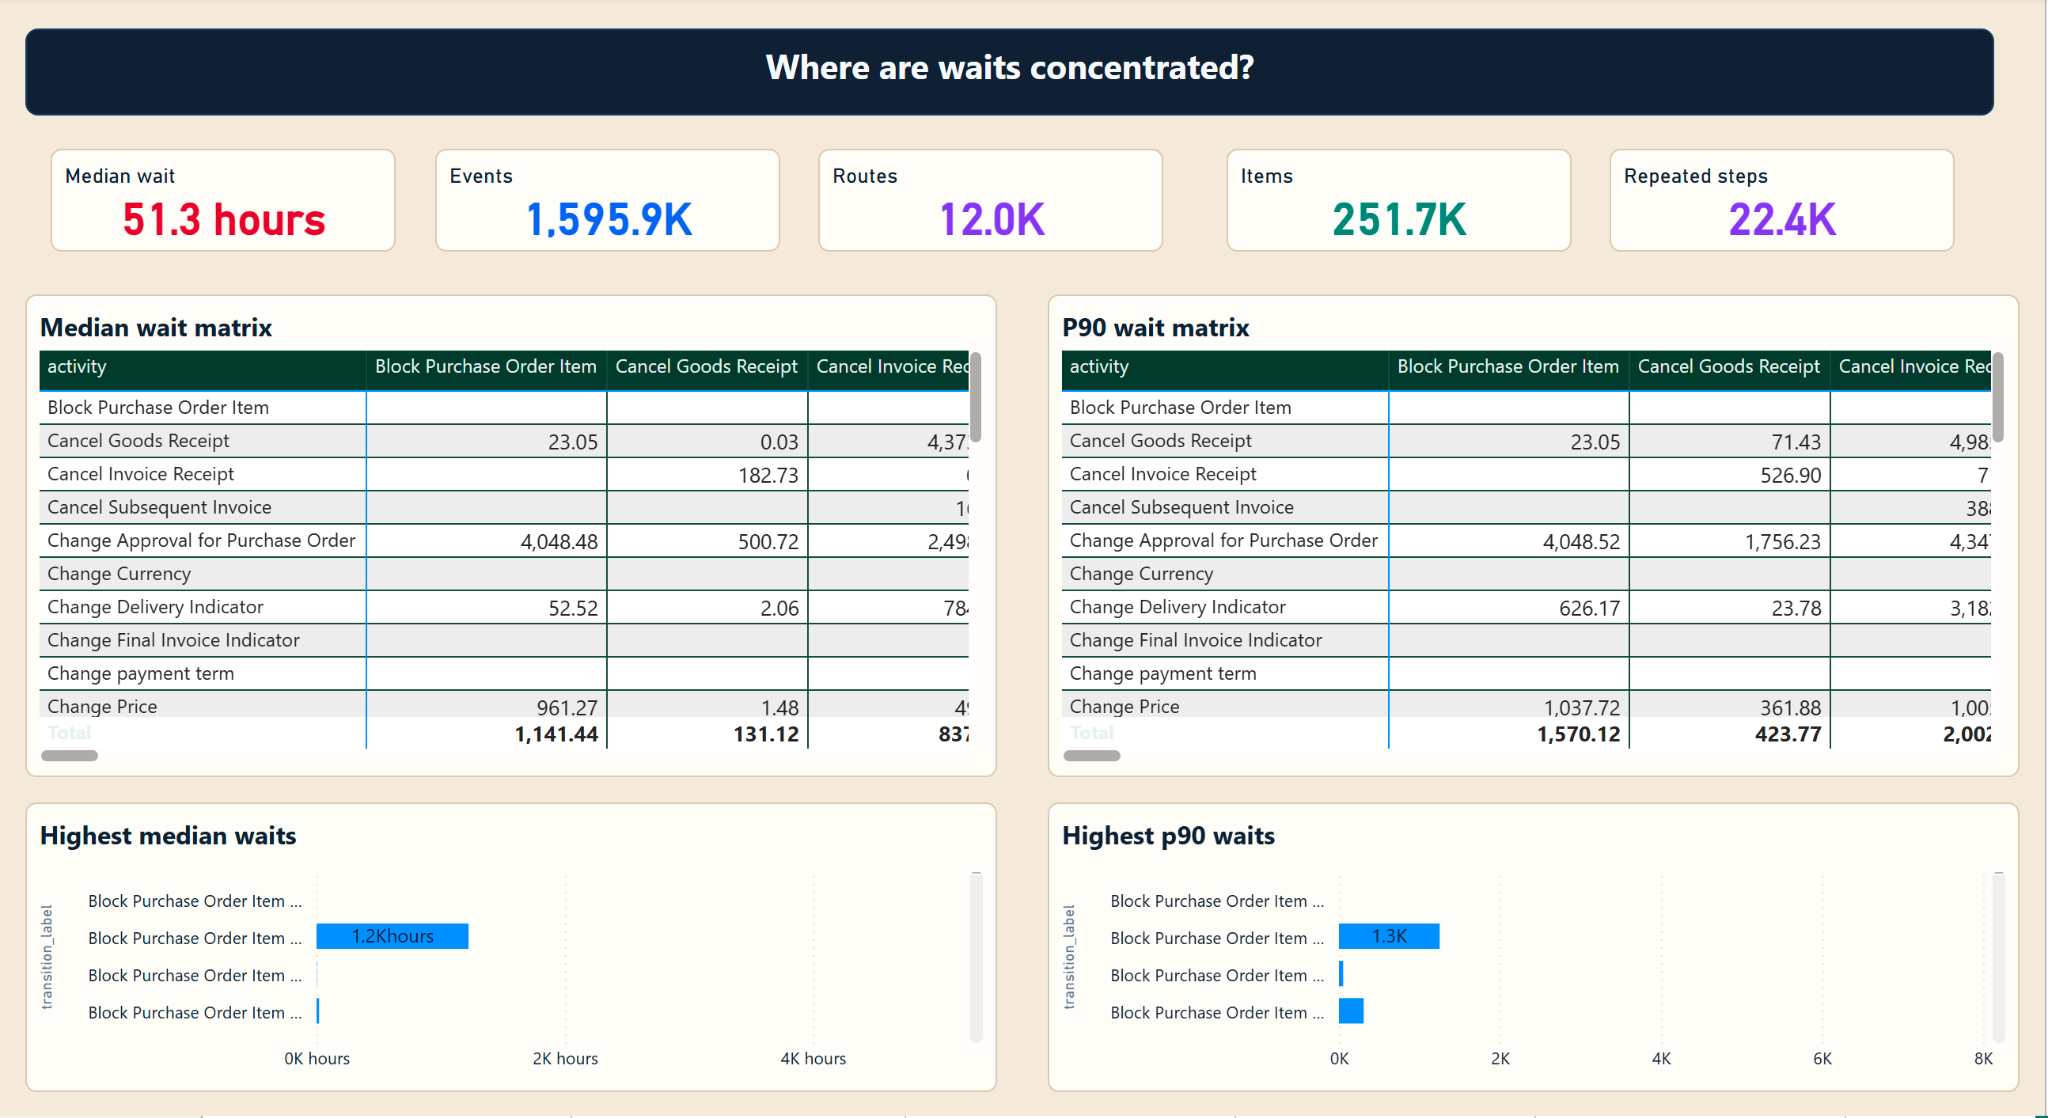
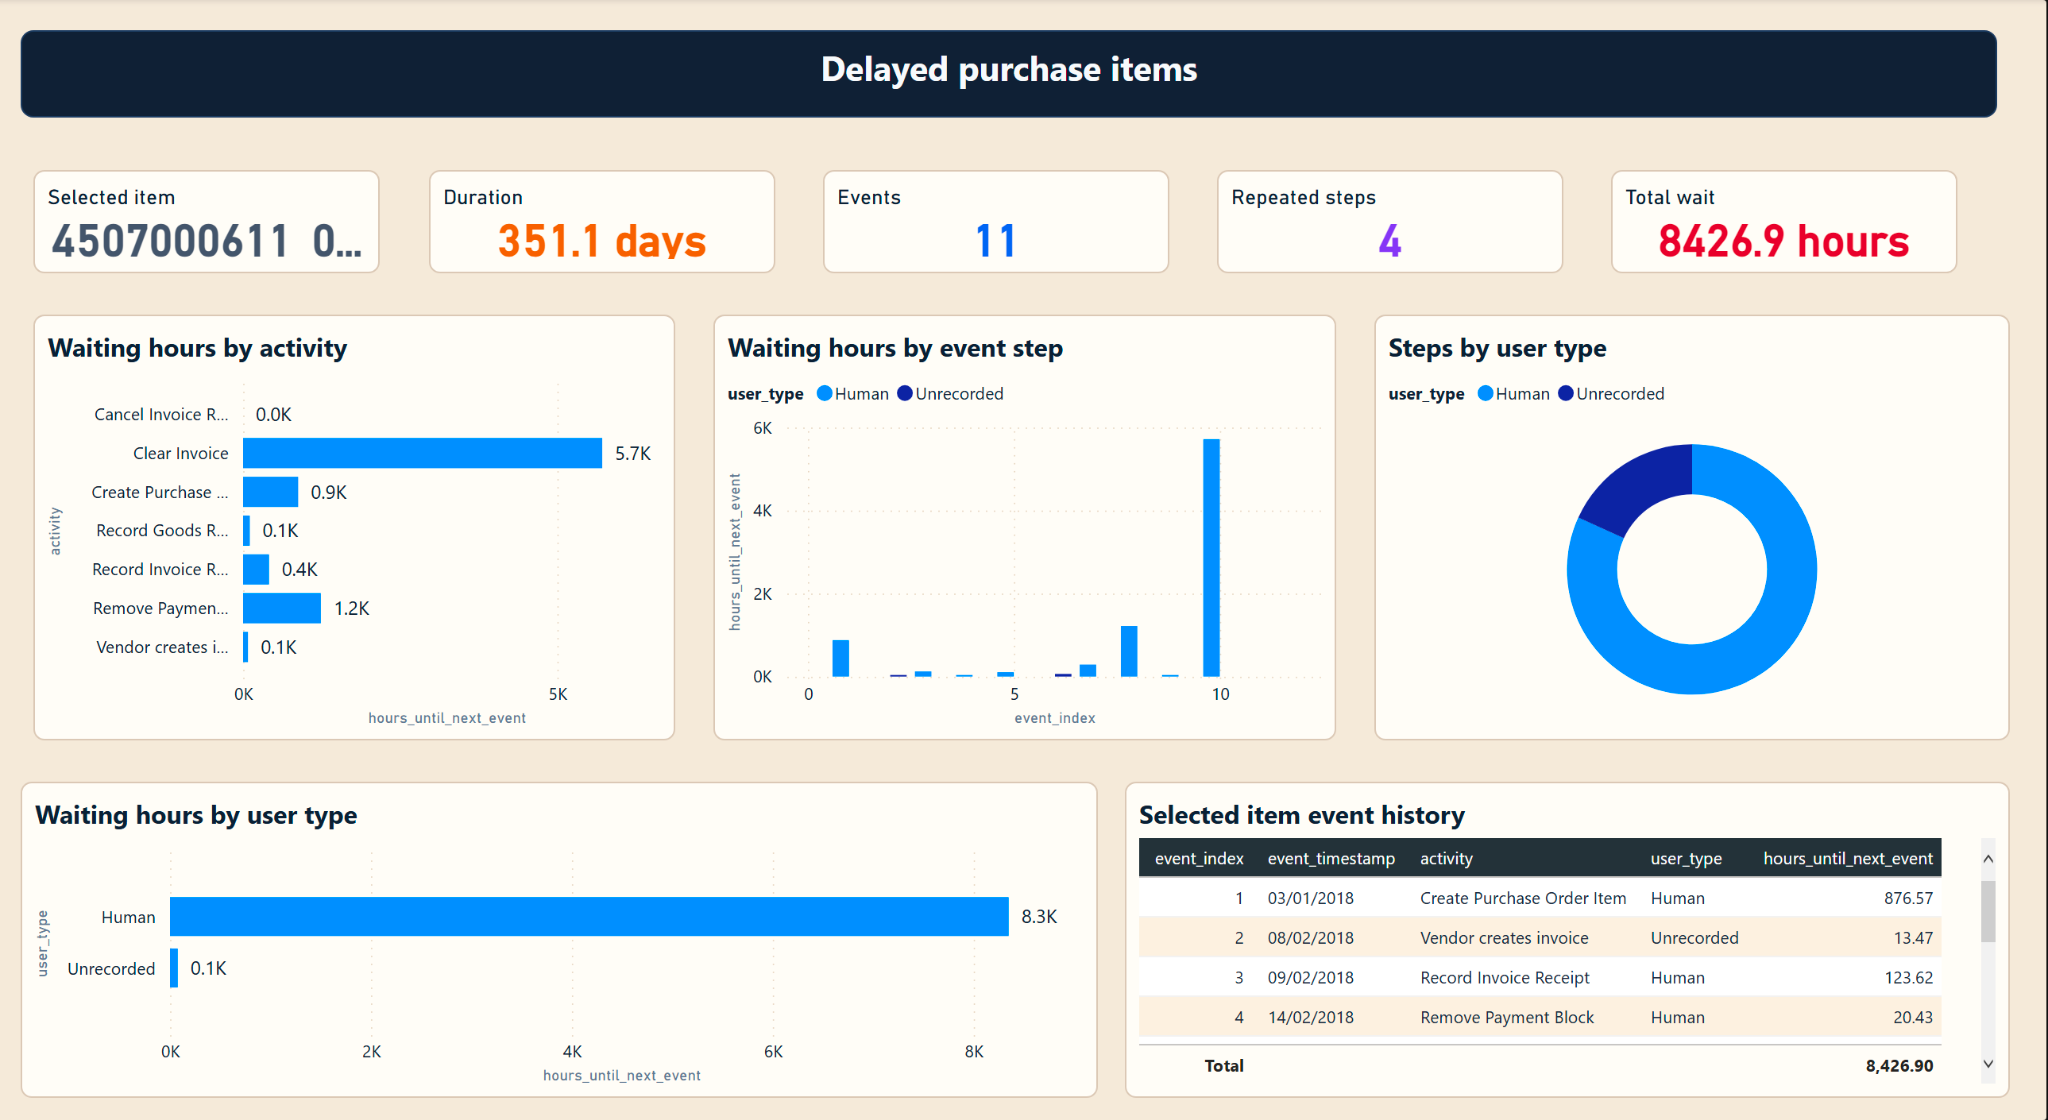
Six pages show where purchase-to-pay work waits, which routes create the most volume, where payment blocks concentrate, how individual items move through the process and whether the report calculations pass validation.
The first page establishes the scale: 251.7K purchase-order items, 1.6M recorded events, 51.3 hours typical wait, 12K distinct routes, 55.9K cases under the PBIX broad payment-block flag and 22.4K items with repeated activity.
Separate pages examine route concentration, wait distribution, payment risk causes and individual item traces. That matters because a high median wait might be driven by a small number of extreme cases or by systemic delays across many routes.
The final page shows 17 passing checks across a 96.9K-row inspection extract. The supplied PBIX and six Desktop captures are retained, while a dated refresh log, Performance Analyzer output and native accessibility evidence remain outstanding.
What the example shows
The six connected pages demonstrate purchase-to-pay process analysis with route, transition, exception and item detail. The report uses historical BPI Challenge 2019 data; no current Performance Analyzer or native accessibility result is claimed.
Page 01 of 6
Reporting governance and data quality
What this report is for
Six pages show whether the expected data arrived, the measures are defined, the totals agree and outstanding actions have owners before the report is signed off.
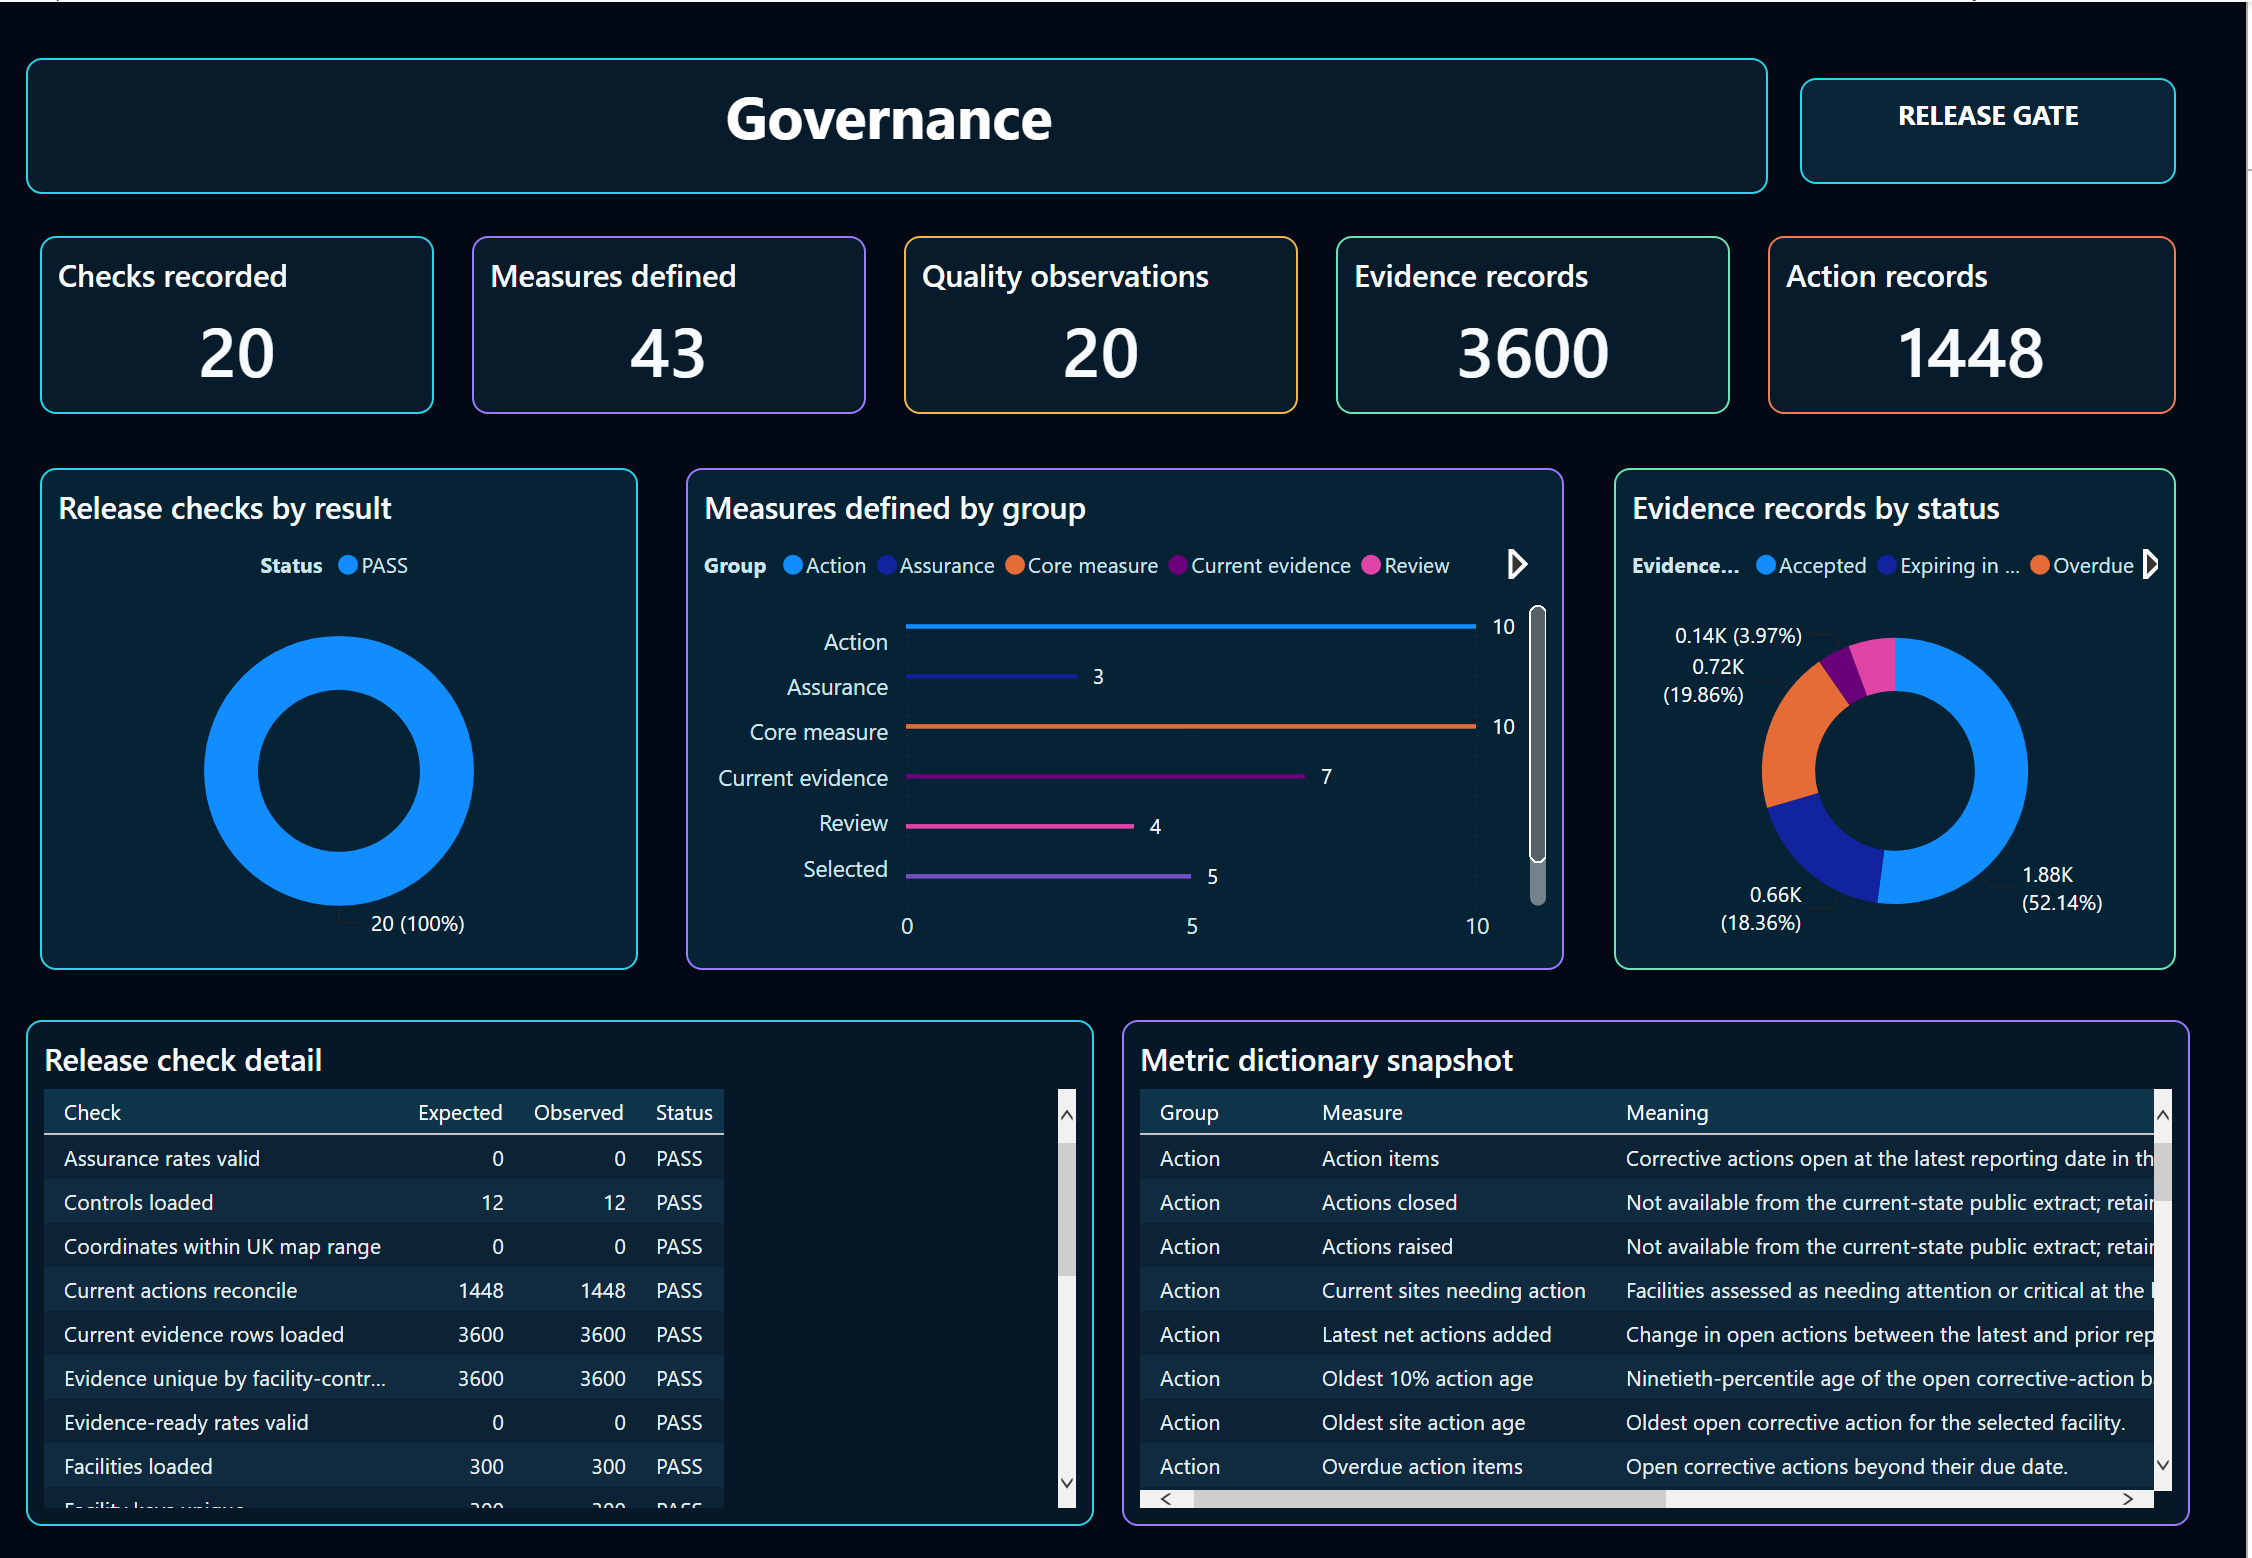
The review starts with a practical question: have the expected records arrived, are the measures defined and do the checks pass? It shows 20 passing checks, 43 defined measures, 3,600 supporting records and 1,448 action records together.
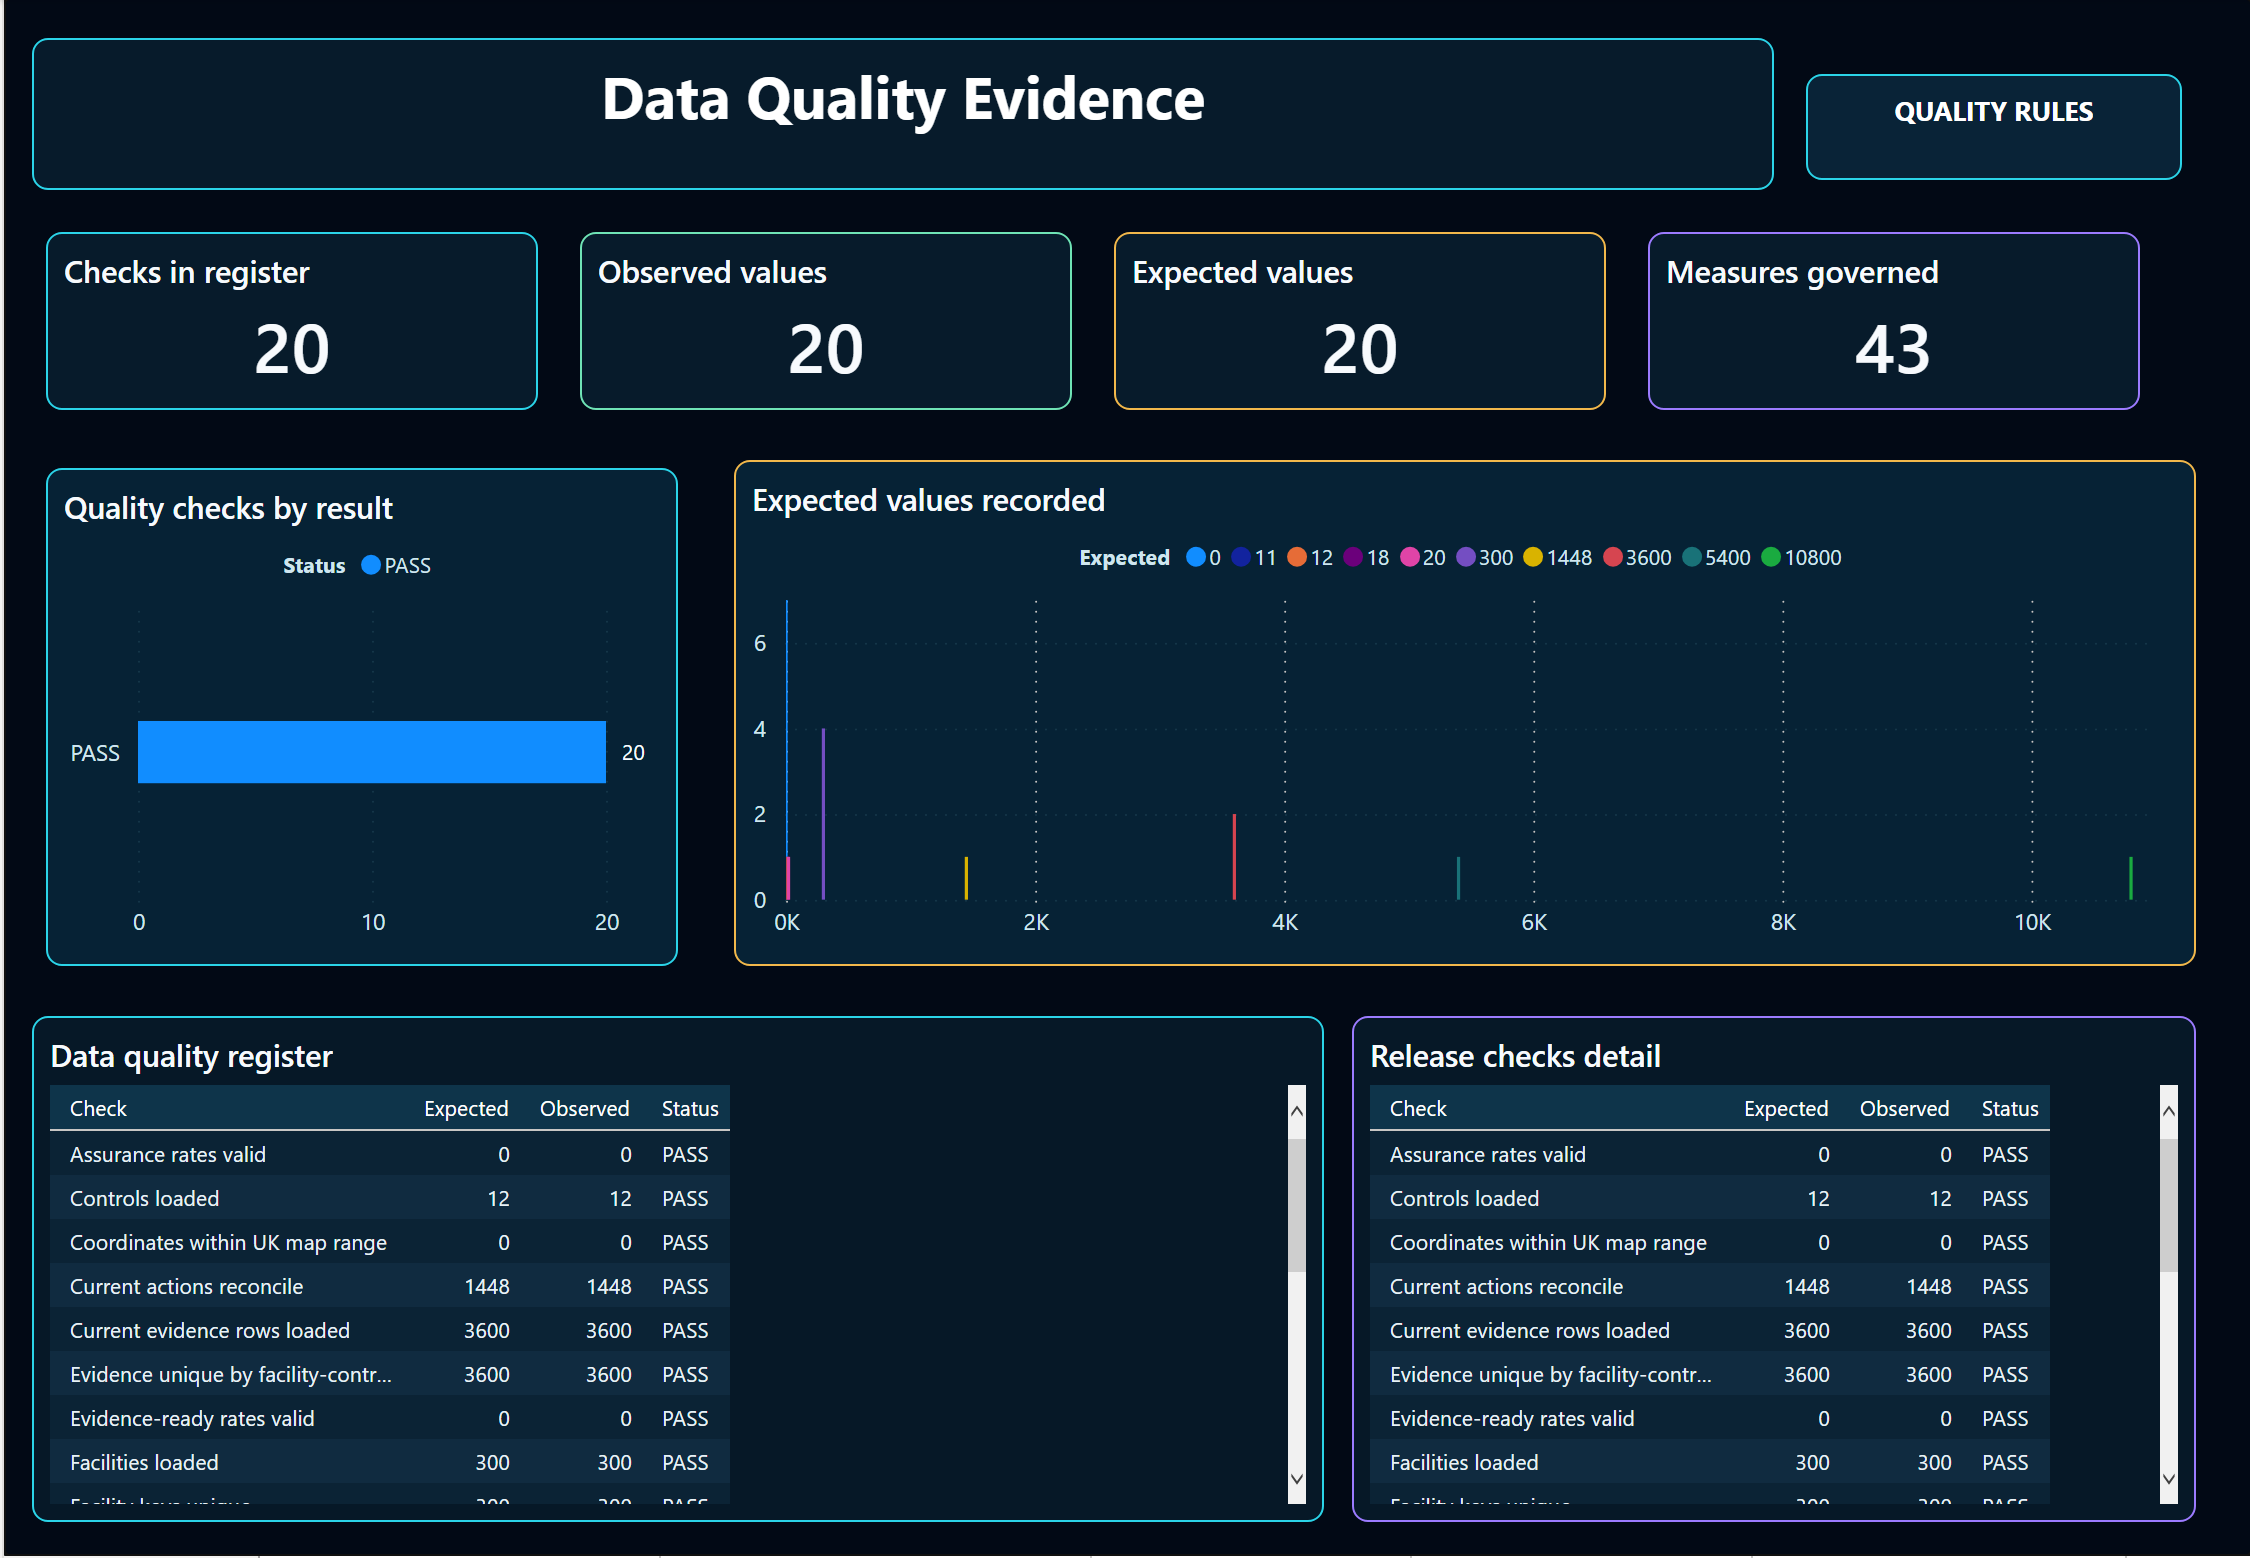
The metric dictionary and data quality pages explain what the measures mean and whether observed totals agree with the rules. Seven measure groups account for all 43 definitions, while the quality register shows the expected value, observed value and result for each of 20 checks.
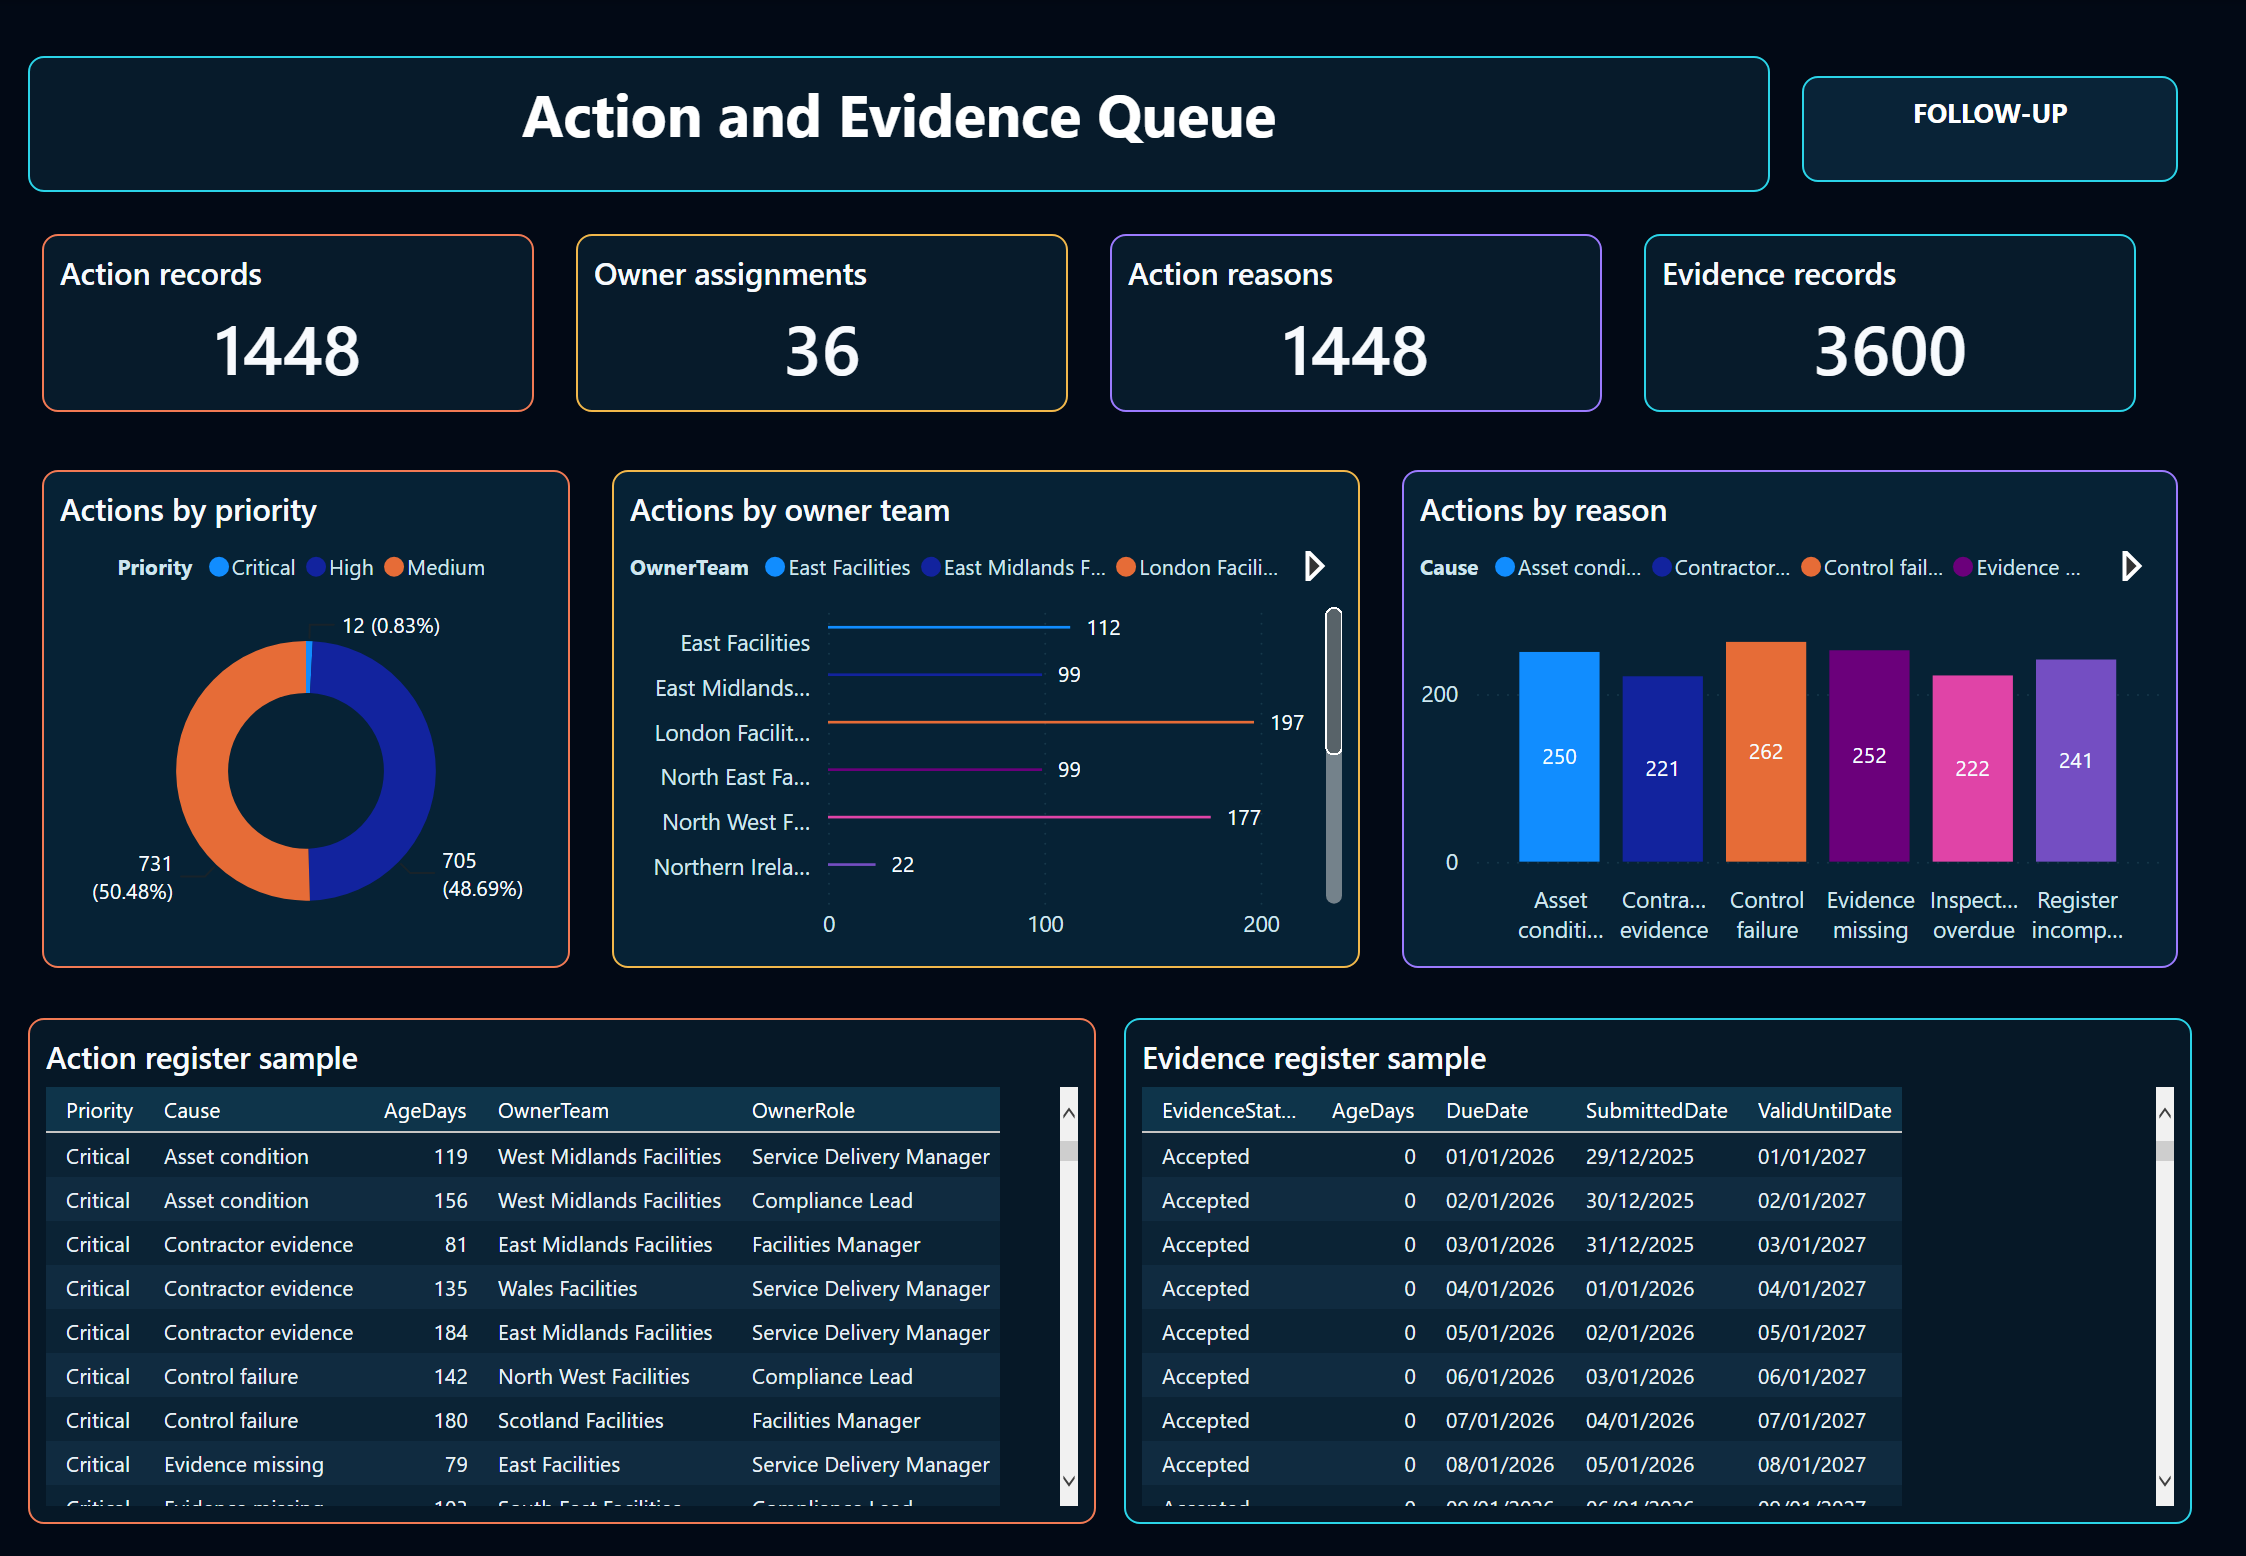
The coverage page ties the model to 300 sites, 12 controls, 10,800 inspections and 3,600 supporting records. The action page provides a second check: priorities and six action reasons each sum independently to the 1,448 actions.
The final page brings the checks and measure definitions together for approval. A production version would still need a named approver, a dated approval, an example of a failed check stopping publication and evidence that it runs properly in Power BI Desktop.
What the example shows
The six pages make definitions, sample records, checks, reconciliations and ownership easy to inspect. The report uses example data, and two presentation choices should be corrected before it is shared.
Page 01 of 6
Package inspection confirms 25 named pages, 249 visual containers, 4 report layouts and 4 data models. The retained screenshots cover facilities review, finance reconciliation, purchase-to-pay process intelligence, reporting governance, contract and facility detail, and the checks shown to a reviewer.
Before live use, each report needs a full refresh followed by a save and reopen test. It also needs Performance Analyser results, a keyboard review and a screen reader review. The finance summary bridge, governance card label and mixed unit quality chart also need correction. These points are stated here so the screenshots are not mistaken for a completed client deployment.
The evidence standard
Strong Power BI work keeps the native file, model structure, Power Query preparation, explicit DAX and report pages available together. Totals are checked against source records, while performance and accessibility are reviewed in the tool rather than assumed from appearance.
A PBIP or PBIX is the starting point. A web recreation can explain the work, but it cannot prove that a Power BI report exists.
The semantic model should make grain, dimensions, facts and time logic clear. Power Query and explicit DAX should remain available for review.
Reported totals and important exceptions need independent checks against retained records. A plausible visual is not enough.
Performance Analyzer, keyboard use, focus order, contrast and alternative text belong in the review before a report is described as ready for wider use.
Microsoft recommends fact and dimension tables at a consistent grain, with a dedicated date table for time analysis. The V3 models still require those structures, current report pages, checked totals, saved performance results and an accessibility review before wider use.
Flagship process review
A historical anonymised purchase order event log is used to find where items wait, which paths are uncommon, where work repeats and how payment blocks enter the process.
Which purchase item paths and hand-offs should be investigated first because they combine volume, waiting time, repeated work or payment blocks?

Verified locally where stated; published source scope is labelled separately.
A working PBIX with six connected Desktop pages is retained beside the verified event-log model, Power Query, DAX and item history.
The current status and remaining limitations are kept with the example.
What must be present
Each V3 project needs a PBIP or PBIX, Power Query, a fact and dimension model, explicit DAX, a date table, native report pages, source tie-outs, saved Performance Analyzer results and an accessibility review. The working files and report captures remain connected to their stated dataset, measures, checks and limitations.
Built by Quanta Meridian using non-client example data. No confidential or protected data is used.
Start with the reporting question
A first review can trace the result from source to model, show where the current logic is difficult to maintain and identify which checks should happen before the design changes.