Quanta Meridian logo

Solution Example collection 03

KPI Definitions and Data Quality

Four reporting questions use the same order-to-delivery records. One compares competing delivery definitions. One reconciles five reported results. The other two follow a failed row through correction, independent retest and the decision to release or hold the report.

Four examples built from purpose-made order and delivery records, with the original workbooks, code, checks and named orders available to inspect.

Evidence architecture

Agree the calculation. Check the records.

The definition and reconciliation agree how the figure is calculated. The data checks and issue register show which records failed, what was corrected and who owns the follow-up. Together they give reviewers the calculation, affected records and accountable owner.

On-time delivery definition comparisonDispatch, partial receipt and final customer receipt dates enter one definition record. Finance and Operations compare their rules before the agreed calculation is used in SQL, Excel and Power BI.ON-TIME DELIVERY DEFINITIONOrder and promisePopulationDispatch eventOperations dateCustomer receiptFinance dateON-TIME DELIVERYMonthly service reviewOrder populationReceipt date rulePartial + cancelledAgreed effective dateSQL resultExcel checkPower BI measure88.9% Finance91.4% Operations
Finance and Operations first agree the date and order treatment. The same calculation can then be tested in every reporting tool.
Validation and issue lifecycleOrder and delivery records pass through named checks. A missing product mapping is corrected by the product data owner and independently retested before report release.ORDER AND DELIVERY CHECKSMonthly recordsOrderDelivery eventProduct codeConfiguredrulesNamed checksChecked ordersService reportMissing product mappingCode addedSecond analyst retests
A failed order remains visible until the missing product code is corrected, a second analyst reruns the check and the reporting owner releases the corrected report.

What can be scrutinised

One generated order-and-delivery model. Four separate claims.

All displayed values come from checked manifests linked to retained build results. The shared deterministic dataset keeps comparison possible; the individual Projects remain responsible for their own rule, result, trace and stated limitation.

SourceD06 order-to-delivery model

Public scopeFour verified Projects only

Evidence standardOriginal file + check results + worked example + limitation

Metric definitions

Agree the rule, then reconcile every implementation.

The definition record settles population, grain, date and exclusions. The reconciliation work then proves why five existing implementations differ and carries each one to the approved result.

01

Definition disagreement

Governed metric passport

Order-to-Delivery Metric Dictionary

Finance and Operations agree what on-time delivery means.

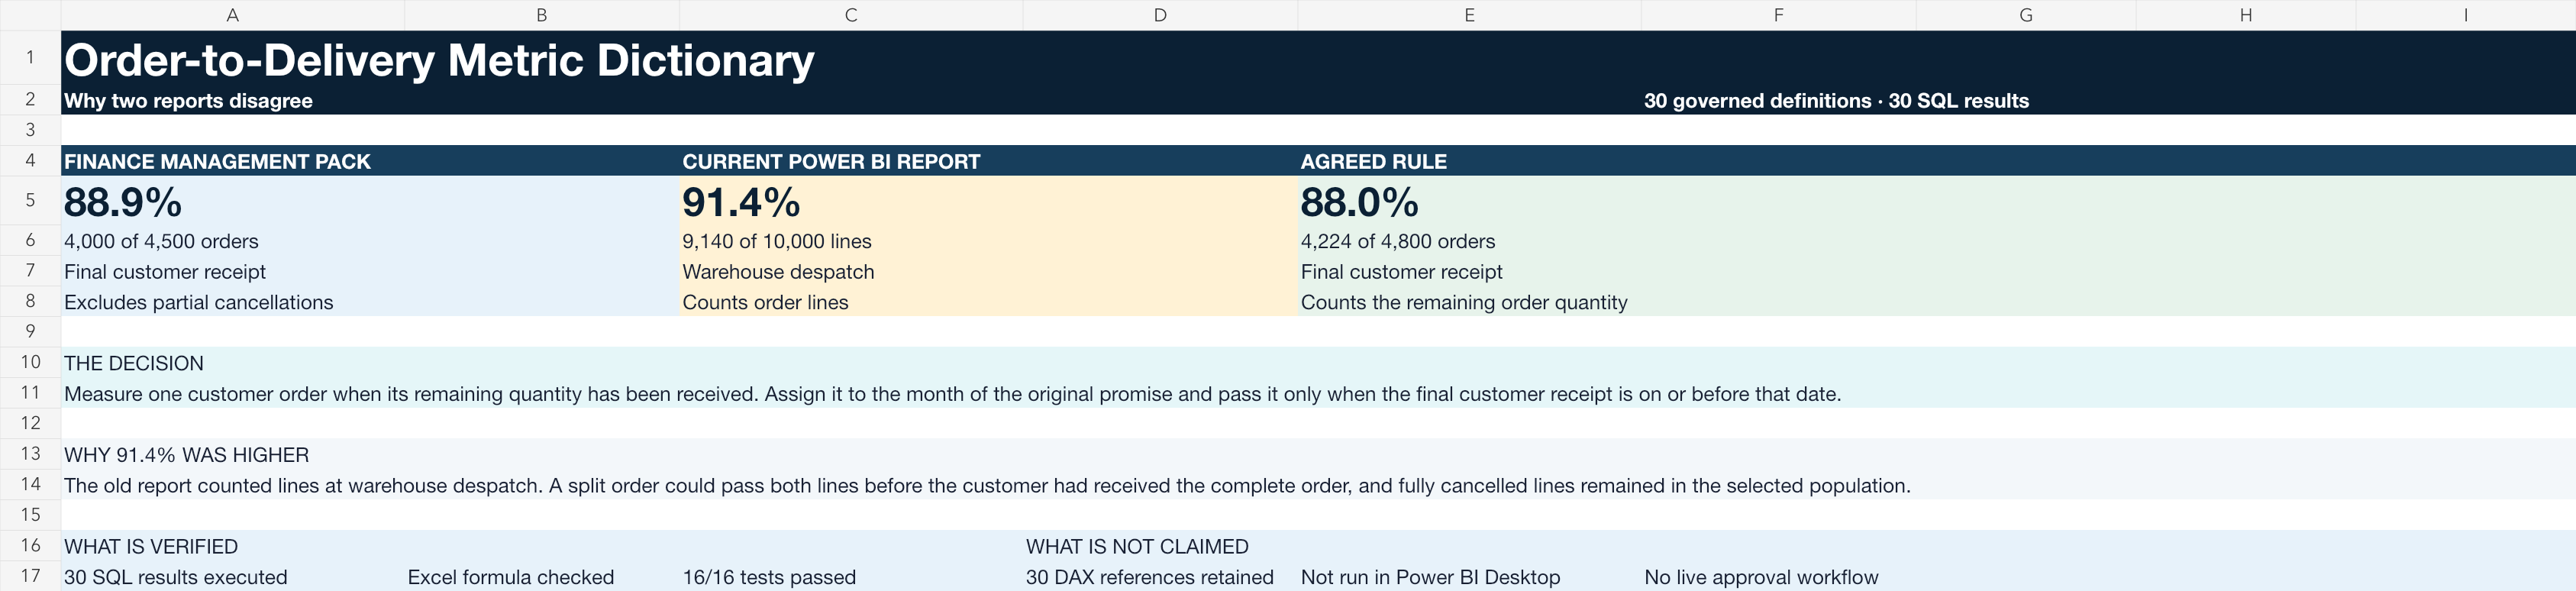
Finance reports 88.9% at complete customer receipt. The current Power BI report shows 91.4% at despatch and line grain. The metric passport fixes the original promise date, final receipt, order grain and treatment of partial and cancelled orders before the reports change.

Reviewer decision

Which on-time delivery definition belongs in the monthly service report, and how should split, partial and cancelled orders be treated?

Population
120,000 orders · 250,000 lines · 180,000 delivery events
Rule or control
One eligible customer order, complete at final receipt, assessed against its original promise date.
Verified result
88.9% Finance · 91.4% current report · 88.0% agreed
Reporting consequence
30 versioned definitions give SQL, Excel and the Power BI model one controlled rule.
Retained artefact

Native Excel catalogue and passport, executed DuckDB SQL, retained DAX and TMDL.

Validation

16 validation checks passed. The DAX is structurally checked, not claimed as a Power BI Desktop run.

Follow one order

ORD-0004001: Follow one split order through the warehouse despatch rule and the agreed final-customer-receipt rule.

Scope, provenance and limitation

Built by Quanta Meridian using deterministic non-client example data. The source code, seed, assumptions and validation results are retained with the project.

The DAX and TMDL are retained and structurally checked but have not been executed in Power BI Desktop.

View definition disagreement details
Native Excel comparison showing Finance at 88.9%, the current Power BI report at 91.4% and the agreed rule at 88.0%
The retained metric passport compares the three results at full worksheet width. 16 validation checks passed.Open Order-to-Delivery Metric Dictionary evidence
02

Calculation reconciliation

Five implementation bridge

Why five reports show different on-time delivery rates

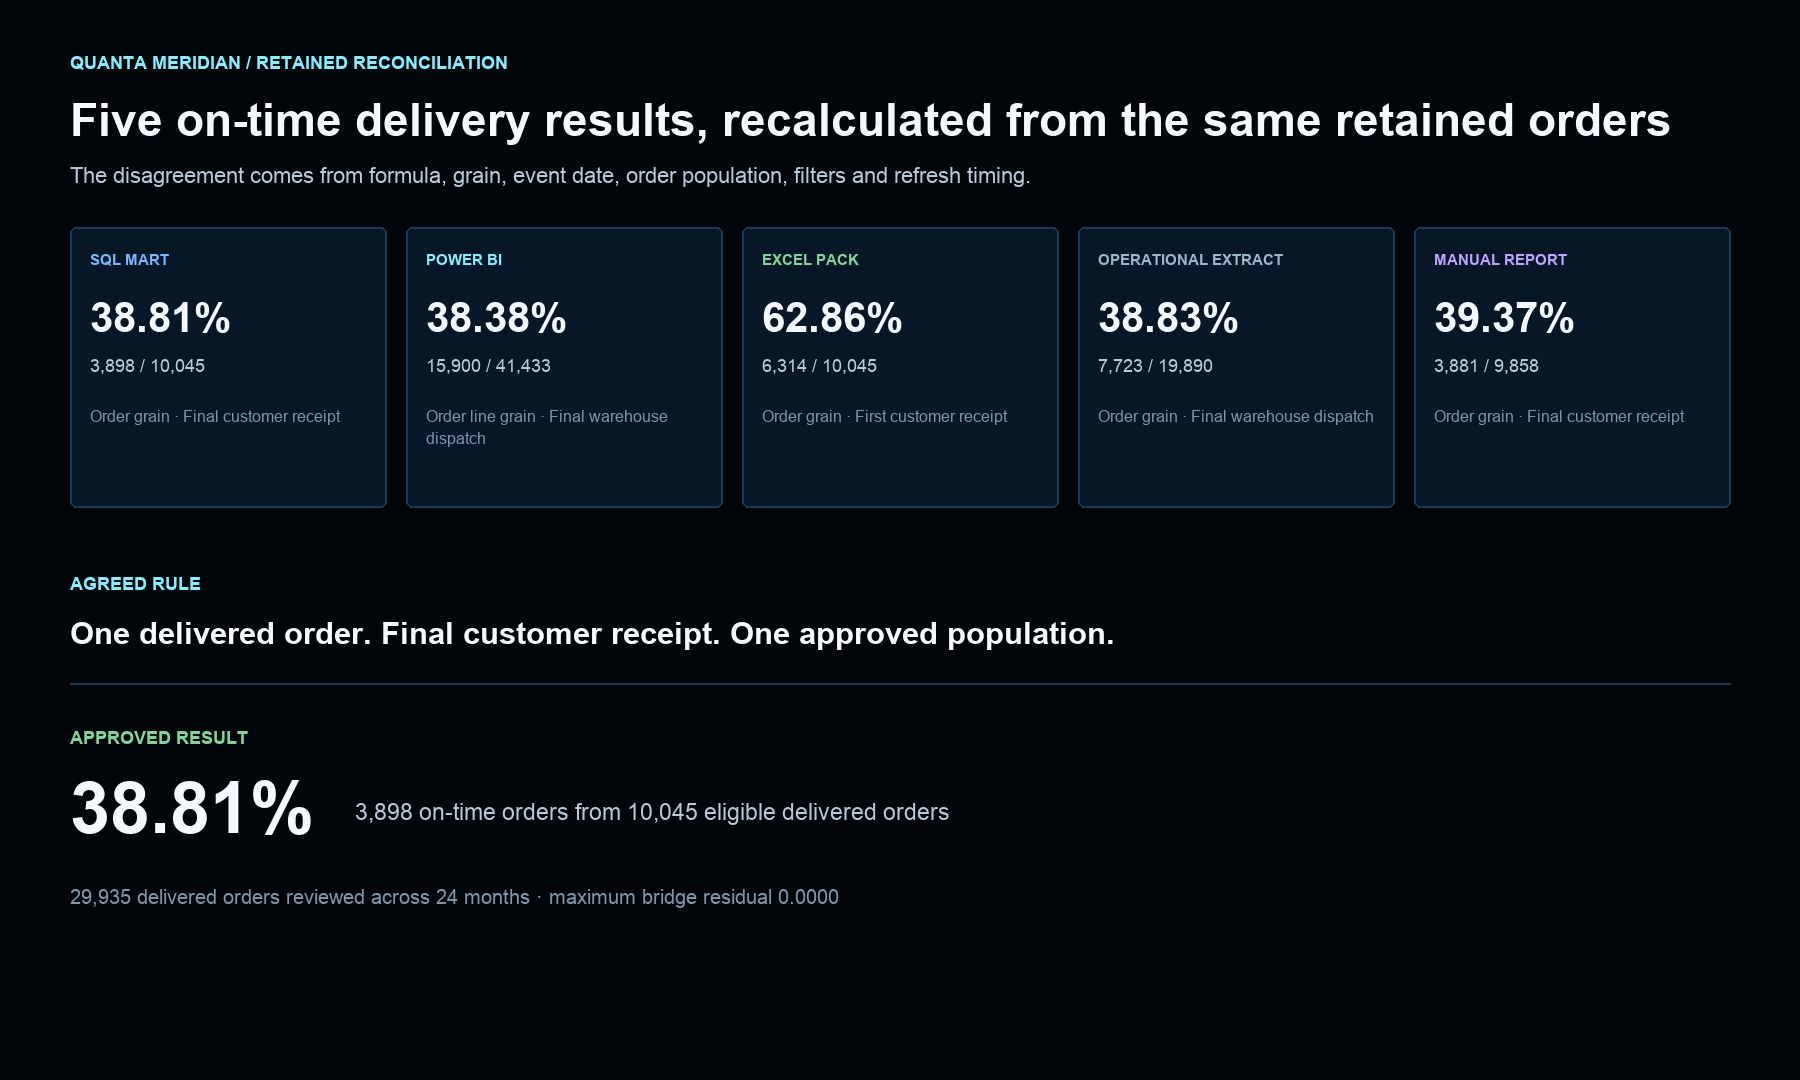
Five on-time delivery percentages return to one approved result.

SQL, Power BI, Excel, an operational extract and a manually maintained report use different formulas, grains, events, filters or refresh times. Each is independently recalculated, one split order is traced and every difference is bridged to 38.81%.

Reviewer decision

Which result should be used in the next review, and what must change in each reporting implementation?

Population
29,935 delivered orders → 10,045 eligible orders
Rule or control
One eligible delivered order; final customer receipt on or before the original promise date.
Verified result
3,898 on-time orders · 38.81% approved result
Reporting consequence
Five implementations reconcile with a maximum residual of 0.0000 percentage points.
Retained artefact

DuckDB and SQL reconciliation, native Excel workpaper and retained DAX.

Validation

19 / 19 assertions passed; the retained DAX was independently re-performed but not executed in Power BI Desktop.

Follow one order

ORD-0000001: Trace one split order through the five calculations and identify why the source date, record grain and report timing change its treatment.

Scope, provenance and limitation

Built by Quanta Meridian using deterministic non-client example data. The source code, seed, assumptions and validation results are retained with the project.

The operational extract and manually maintained report are retained calculation snapshots, not live connected reports.

View calculation reconciliation details
On-time delivery reconciliation comparing five implementations with the approved result of 38.81%
The retained workpaper shows the recalculated values, five exact bridges and 19 / 19 passing assertions.Open Why five reports show different on-time delivery rates evidence

Data quality operations

Hold failed records, then retest the correction.

Checks that run against the data keep individual failed rows and their reporting impact. A separate issue record retains the owner, correction, independent retest and publish or hold outcome.

03

Failed records

Executable release control

Order and Delivery Data Quality Checks

Failed order rows hold the monthly report until retest.

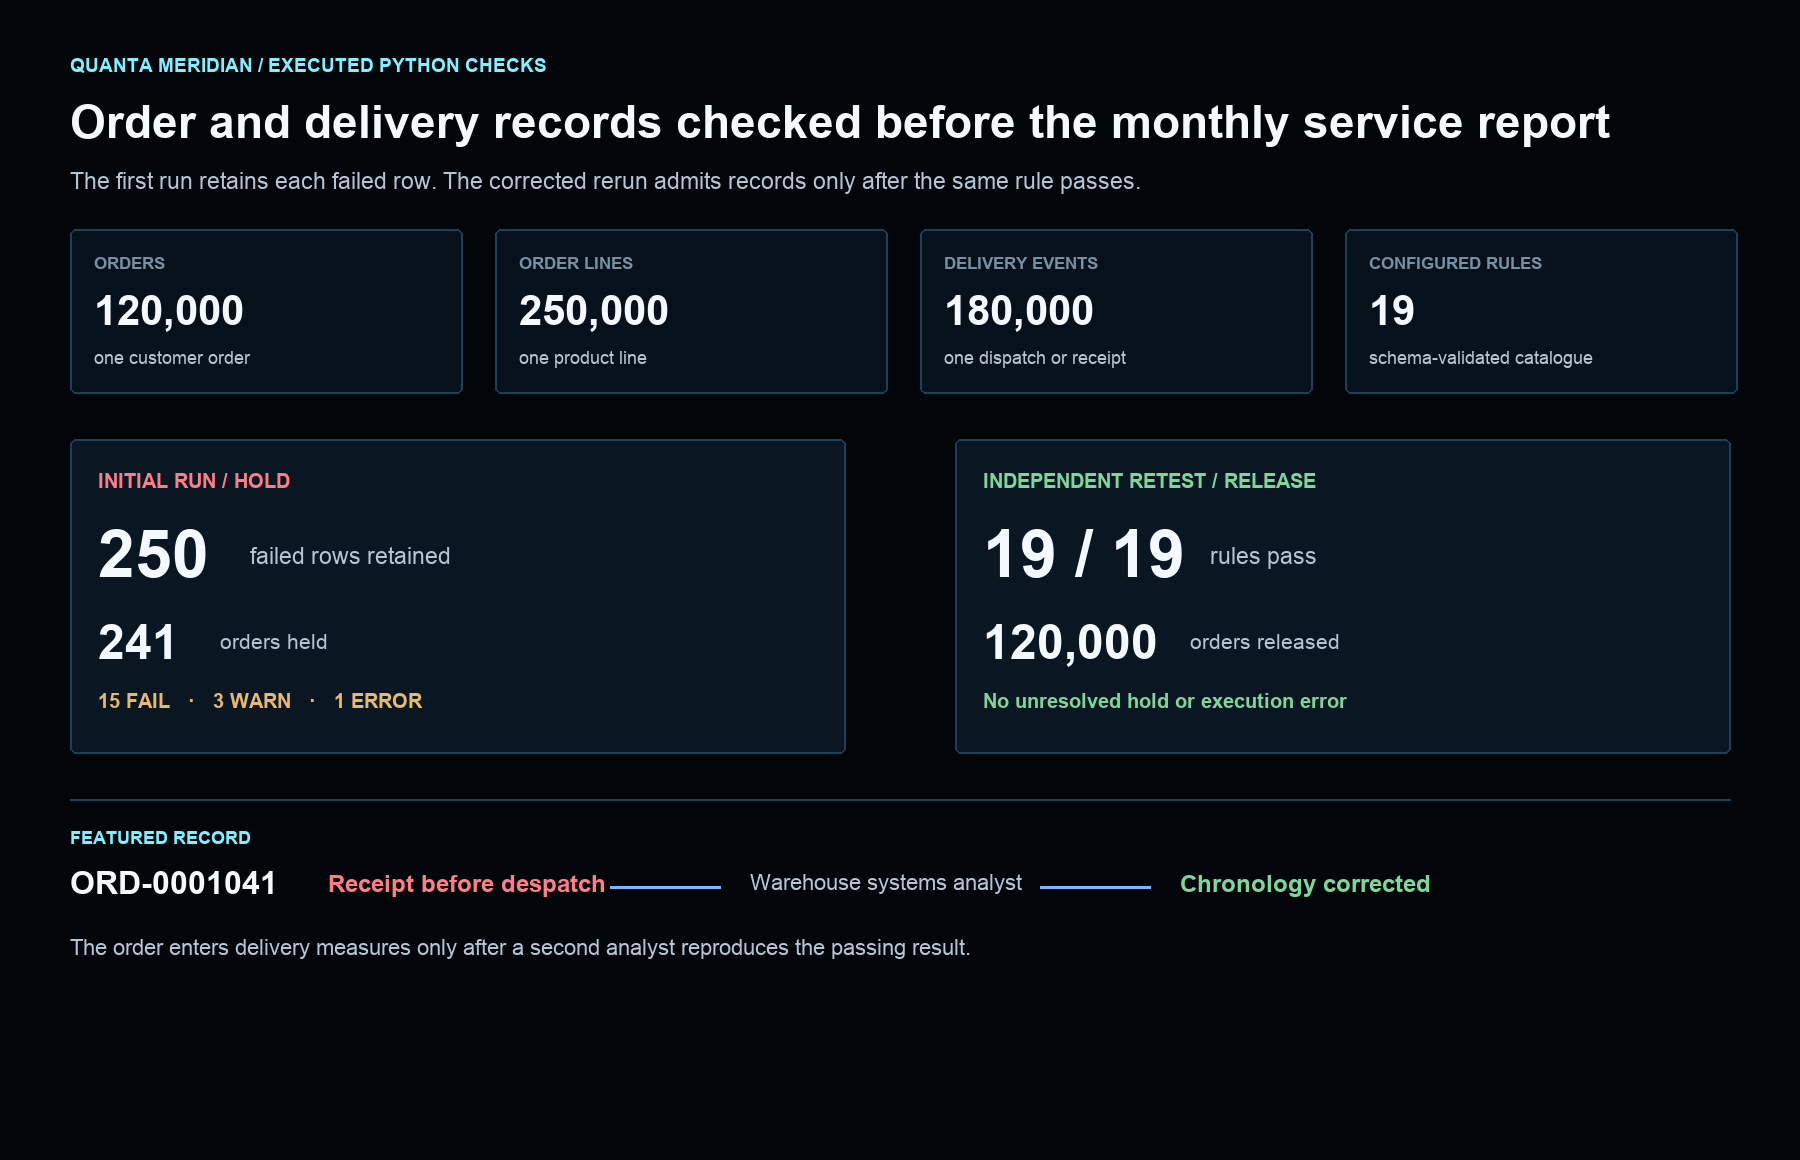
The executed checks retain missing references, repeated keys, malformed values, impossible dates and incomplete files as individual failed rows. The first run records 250 failures and holds 241 orders; an independent reviewer then reruns the same rule catalogue after correction.

Reviewer decision

Can the service report be released, released with a stated limitation or held for correction?

Population
120,000 orders · 250,000 lines · 180,000 delivery events
Rule or control
Configured field, reference, sequence and threshold checks, with each hold tied to its affected order.
Verified result
250 failed rows · 241 orders held
Reporting consequence
19 / 19 rules pass after correction, allowing the retained monthly report to be released.
Retained artefact

Executed Python and DuckDB build, YAML rules, failed rows, corrections and retest history.

Validation

19 / 19 rules passed on independent retest and every held order was accounted for.

Follow one order

ORD-0001041: Trace one impossible receipt-before-despatch sequence through failure, correction, independent retest and report release.

Scope, provenance and limitation

Built by Quanta Meridian using deterministic non-client example data. The source code, seed, assumptions and validation results are retained with the project.

Passing checks cover only the configured fields, references, sequences and thresholds.

View failed records details
Order and delivery quality evidence showing 250 failed rows, 241 held orders and 19 / 19 rules passing after correction
The executed evidence view retains failed rows, report impact and the independent 19 / 19 retest result.Open Order and Delivery Data Quality Checks evidence
04

Incident and retest

Owned correction route

Reporting Data Issue and Retest Register

A missing product mapping stays open until a second analyst retests it.

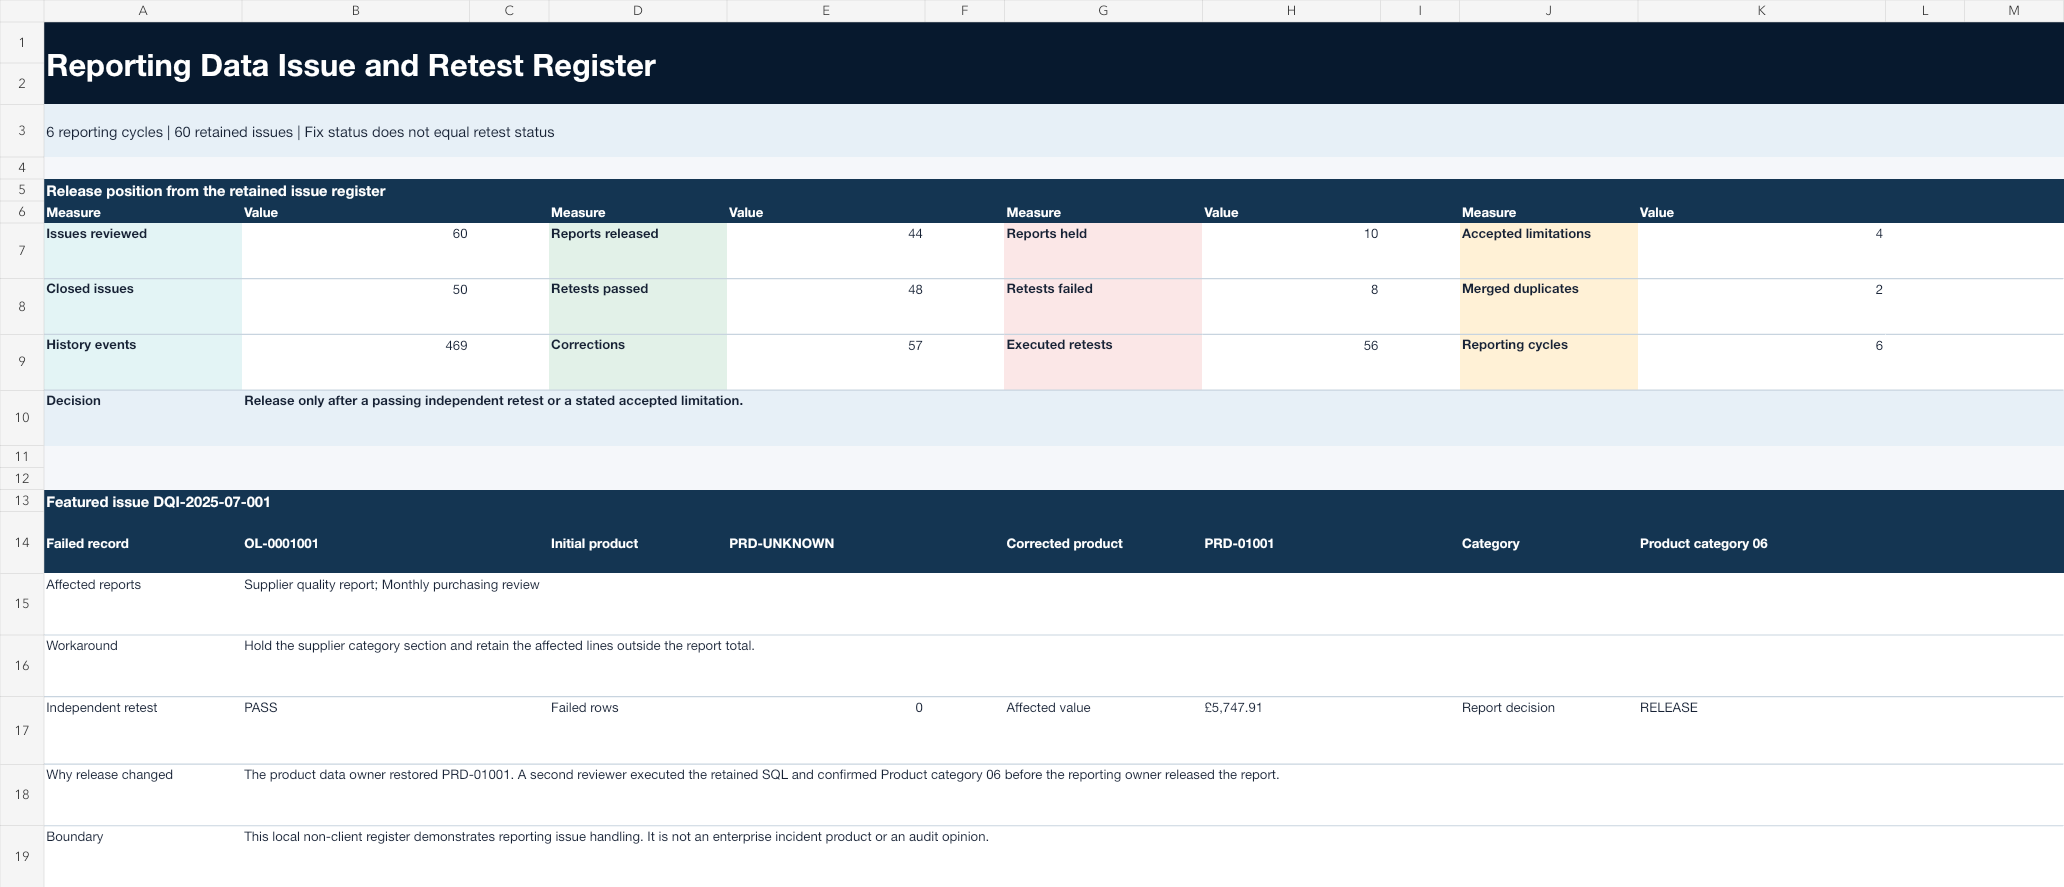
Order line OL-0001001 cannot be assigned to Product category 06, so the affected supplier report remains held. The product data owner corrects the mapping, an independent reviewer runs the saved SQL and the reporting owner records whether the report can be published.

Reviewer decision

Has the missing mapping been corrected and independently retested well enough to release the supplier report?

Population
60 reporting issues across six monthly cycles
Rule or control
A report may be released only after a passing independent retest or an explicit accepted limitation.
Verified result
469 hash-linked history events · 56 independent retests
Reporting consequence
28 / 28 build controls pass; OL-0001001 returns Product category 06 and PASS before release.
Retained artefact

DuckDB issue model, native Excel register, SQL retests, report decisions and append-only history.

Validation

28 / 28 lifecycle, role-separation, history and trace controls passed.

Follow one order

OL-0001001: Trace OL-0001001 from failed mapping through impact triage, source correction, independent SQL retest and report release.

Scope, provenance and limitation

Built by Quanta Meridian using deterministic non-client example data. The source code, seed, assumptions and validation results are retained with the project.

The register covers defects raised by the configured checks; it does not prove every retained value or reporting rule is correct.

View incident and retest details
Native reporting issue register showing 60 issues, 56 independent retests and 28 / 28 passing controls
The native register retains 60 issues, 469 history events and 56 executed retests; 28 / 28 controls passed.Open Reporting Data Issue and Retest Register evidence

Continue from the evidence

Start with the reporting consequence. The technical response depends on whether the immediate need is a governed calculation, an executed check or an owned correction.

Capabilities used

SQLRecalculate the population, compare records and retain each exception.
PythonExecute configuration-driven rules and preserve run and failed-record evidence.
Power BIImplement measures whose formula and filter context match the approved definition.

Start with the disputed figure or failed report

Bring the disputed definition, underlying extract and reporting deadline.

The first review can establish whether the problem sits in the measure rule, the records, an inconsistent implementation or an unresolved owner action.

Discuss the reporting problem