L0
Landing
Retain the imported invoice, order and stock columns.
- invoices_raw
- purchase_orders_raw
- stock_movements_raw
CheckLoad count, file date and table metadata

Analytics Engineering
For reporting and data teams whose important figures depend on repeated transformations, unclear joins or datasets that have drifted apart.
Quanta Meridian builds facts and dimensions for orders, invoices, receipts and reference data, then retains the SQL, tests and record traces that explain each published total.
The wholesale mart shows how invoice, purchase and stock records become shared reporting tables. The matching project compares purchase orders, warehouse receipts and supplier invoices before payment, while the delivery projects prove one metric definition across SQL, Excel and Power BI.
When the model needs attention
A distributor can process orders, invoices and warehouse receipts successfully while still lacking reporting tables that Finance and Operations can use consistently.
If one report joins invoice lines to order-level delivery records and another averages delivery lines, both queries may run while producing different totals. The disagreement starts with grain, not presentation.
The engineering work gives each fact a declared row meaning, uses shared customer, product and date dimensions, and keeps the tests that reconcile published figures to the retained orders, invoices and receipts.
Each layer has a specific job, a named table and a check before the next model uses it.
Retain the imported invoice, order and stock columns.
Standardise names, types, keys and record rules.
Apply purposeful joins and reusable business logic.
Publish facts, dimensions and agreed measures.
Fact grain, measures, refresh owner and known limitations remain beside the model.
Why the structure matters
Layers and tests are useful because they connect a question about a figure to the exact record and calculation that need attention.
Run the same orders, invoices and rules through documented preparation steps instead of reconstructing logic from a finished report.
Trace a figure to the invoice line or order event, calculation, definition and check that produced it.
See which models, reports and owners are affected before a changed file or rule is released.
Engineering method
The model moves from imported transaction tables to business-shaped facts and dimensions. Each step has one purpose, a named table and a point where it can be checked.
The reporting question and row grain are agreed before invoice lines, order lines, receipts or delivery events are joined. That prevents a one-to-many relationship from multiplying a financial or service total.
Orders, invoices, receipts and reference records are typed and standardised in named stages. Shared keys and business rules are applied once before facts and dimensions are published for Excel or Power BI.
The retained build includes executable SQL or Python, mappings from business fields to report columns, failed records and instructions for rerunning the result after a monthly file or definition changes.
The maintained reporting model
The reporting question, row grain and available records determine the model. Its contract, transformations, failed tests and rerun instructions remain connected to the tables another analyst uses.
Agree which records enter the model, what each table means and what must remain true.
The build retains operational table register and contract, declared grain and key rules and field-to-model mapping.
Move the logic out of repeated reports and into models with one clear purpose.
The build retains landing and staging models, intermediate transformations and reporting marts and semantic definitions.
Leave the checks and documentation needed to rerun, investigate and change the model.
The build retains automated tests and failed records, lineage and build instructions and named ownership and known limitations.
Working environments
The same model discipline applies whether the build is compact or sits inside a larger data environment.
Relationships, repeated transformations, history or record-level traceability need a structured model.
The model still needs an agreed grain, business definitions and checks; SQL alone does not provide them.
Validation, file handling or analysis needs configuration, tests and retained run evidence.
Python is used for a clear task with declared records and results, not as an unexplained processing layer.
A curated model needs shared measures and an accessible way to inspect reporting detail.
The semantic model consumes agreed data; it should not become the hidden home for every transformation.
Model changes need review, history and instructions that remain beside the working code.
Version control records a change. It does not replace testing, ownership or an agreed release process.
Verified project evidence
The examples cover dimensional reporting, reconciliation logic, executable validation and a metric definition carried across several reports.

A wholesale reporting mart built from Microsoft’s Wide World Importers sample database so sales, purchasing, stock and margin reports use the same customers, products, dates and totals.
The retained result combines the actual query result with the release decision. It shows what loaded, what the latest monthly mart contains and whether the checks allow publication.Inspect this project
A three-way reconciliation checks whether the purchase order, warehouse receipt and supplier invoice agree before an invoice is cleared for payment.
The evidence view is generated from retained BPI matching outputs after all 21 checks pass.Inspect this project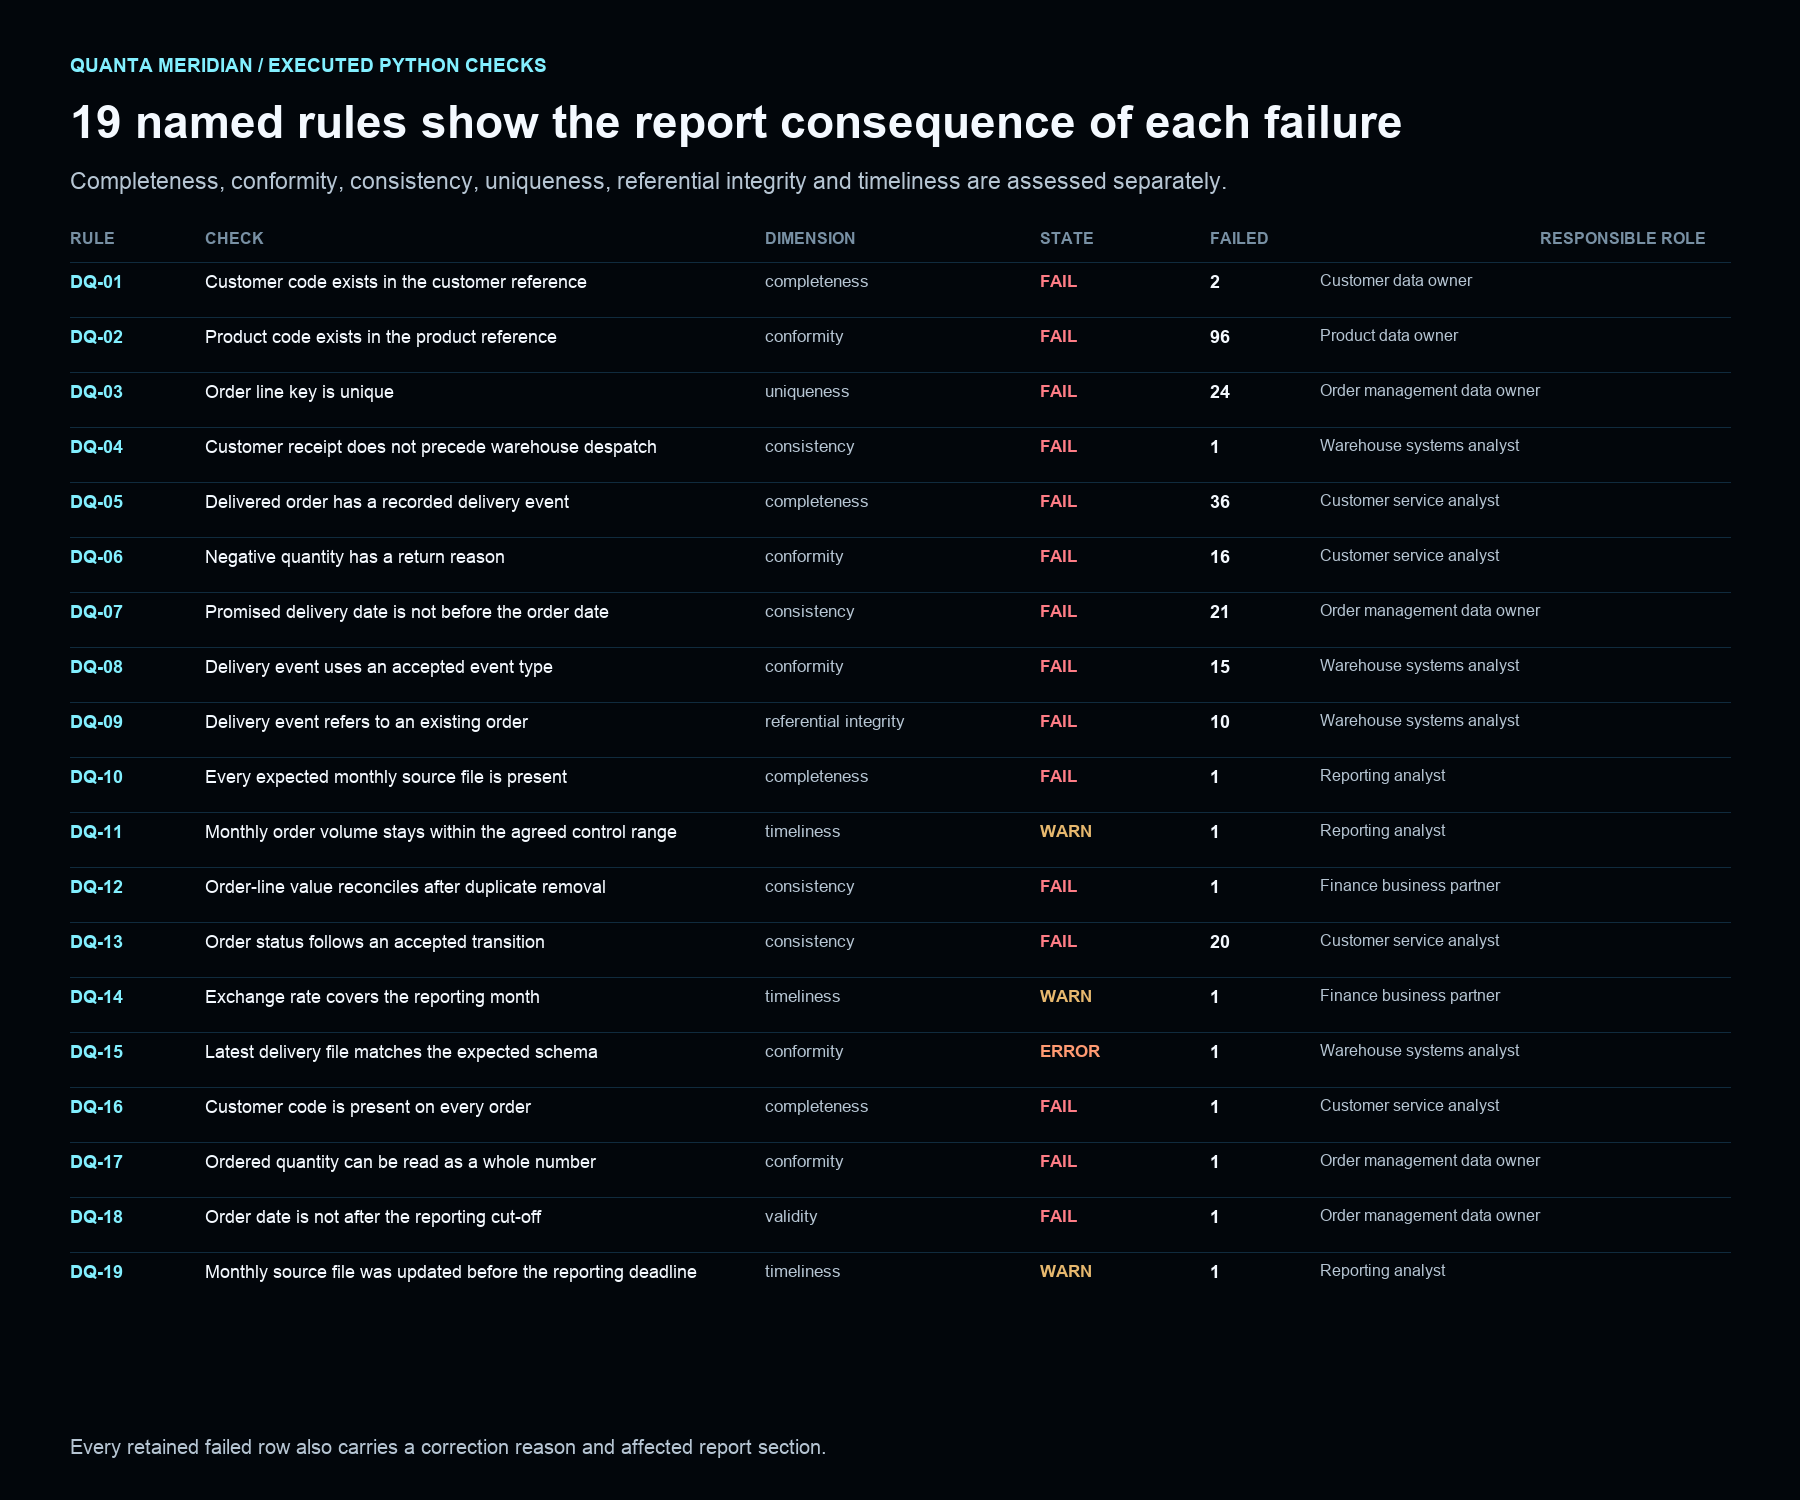
A repeatable set of checks that stops incomplete or contradictory order records from entering the monthly service report and gives each failed row a specific correction reason.
The initial run separates 15 failures, three warnings and one execution error. Each row also retains the affected report section and correction reason.Inspect this project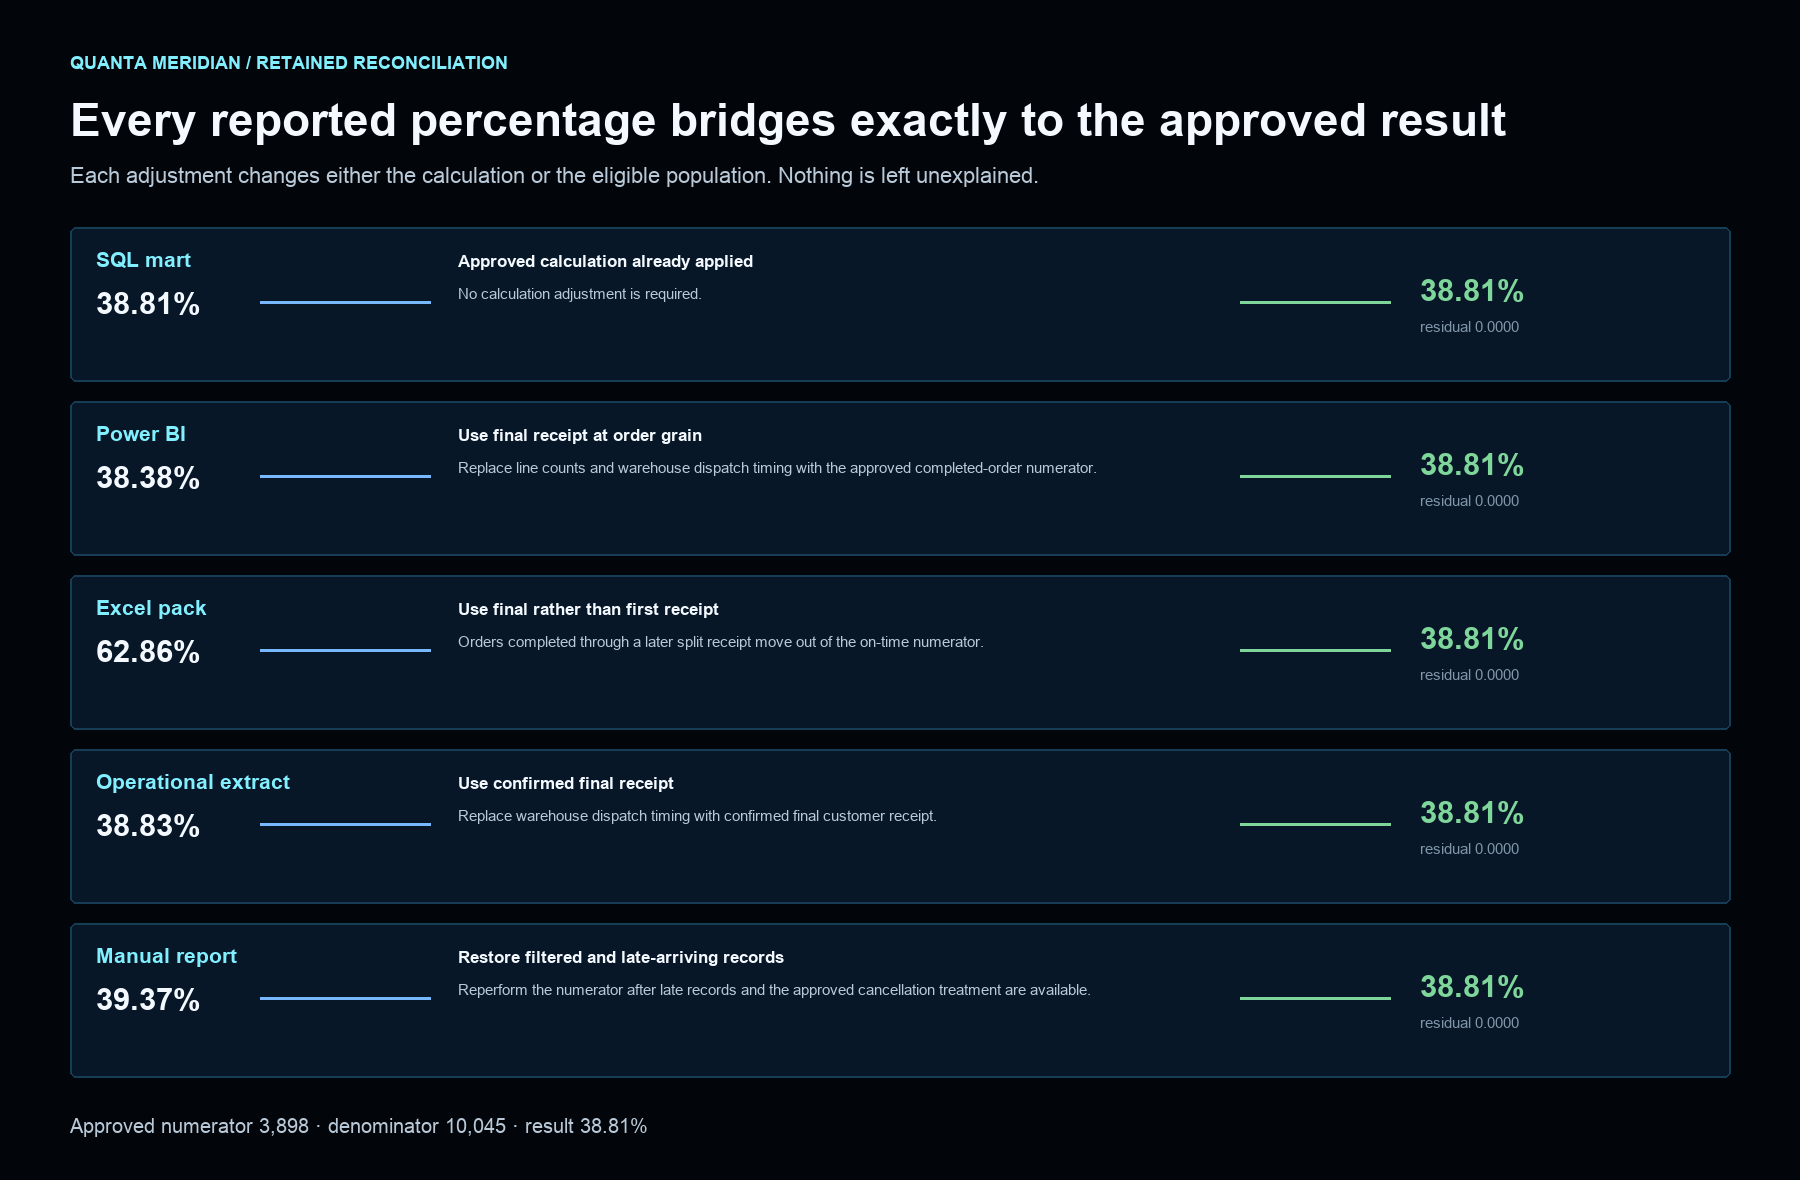
A row-level reconciliation explaining why the SQL reporting mart, Power BI model, Excel management pack, operational extract and manually maintained report show different on-time delivery percentages.
Calculation, event-date, record-grain and extract-population adjustments bring every reported version to the same numerator and denominator with no residual.Inspect this projectRelated capabilities
SQL gives invoice lines, orders, receipts and reference data a declared grain before they become shared reporting totals.
See how it is used in projectsPython turns a reporting check into an executable rule that retains the failed rows, run time, affected report and later retest.
See how it is used in projectsPower BI connects an agreed management question to a dimensional model, explicit measures and the records needed to explain the result.
See how it is used in projectsWorking boundary
The work is shaped around an agreed reporting need and the records available. It does not imply a full data-platform programme, a particular cloud product or production scale that has not been demonstrated.
Bring one report or dataset whose logic is difficult to trace and a short account of how it is refreshed today. Confidential or protected data is not needed for the first conversation.
Discuss a reporting modelReturn to all solutions